


Yesterday, Bitcoin reclaimed $70,000. Ether went up over 5%. Cardano, Chainlink, and a handful of other alts began posting their best gains in days. If you've been watching the market and wondering what just happened, this is your breakdown. We'll walk through the macro forces that sparked the move, what the charts are saying, and the extra fuel that helped push prices higher. By the end, you'll know exactly what to watch next.
The Macro Picture: What Sparked the Rally
Ceasefire Hopes Are Shifting the Mood
Markets have been on edge for weeks, with geopolitical tensions in the Middle East keeping a lid on risk appetite across the board. That changed on Monday morning when new reports suggested the odds of a ceasefire between key parties in an ongoing regional conflict are rising.
The effect was immediate and broad. Oil dropped from Friday's close, stock futures climbed, and crypto surged, with Bitcoin hitting a weekly high above $70,000. Gold, the go-to safe haven in times of fear, barely moved. That's telling: when gold flatlines and risk assets rally, it means investors aren't fleeing exactly.
But the Rally Has a Ceiling… For Now
Here's where the situation gets more nuanced. Ceasefire rumors is not the same as a ceasefire. Analysts are clear on this: until the Strait of Hormuz is physically reopened and ships are moving through it again, the underlying risk premium doesn't fully disappear.
This same pattern, optimism followed by a fade, has played a few times since late March. Each time, the rally ran out of steam when the news didn't materialise into action.
What the Prediction Markets Are Pricing In
Prediction markets offer a useful real-time read on how informed participants are actually positioning. On Myriad, the probability of a ceasefire in the first half of the year jumped by over 10% on Monday, a meaningful move, but still sits at around 46% at the time of writing. In other words, the market sees it as more likely than not that this doesn't fully resolve in the near term.
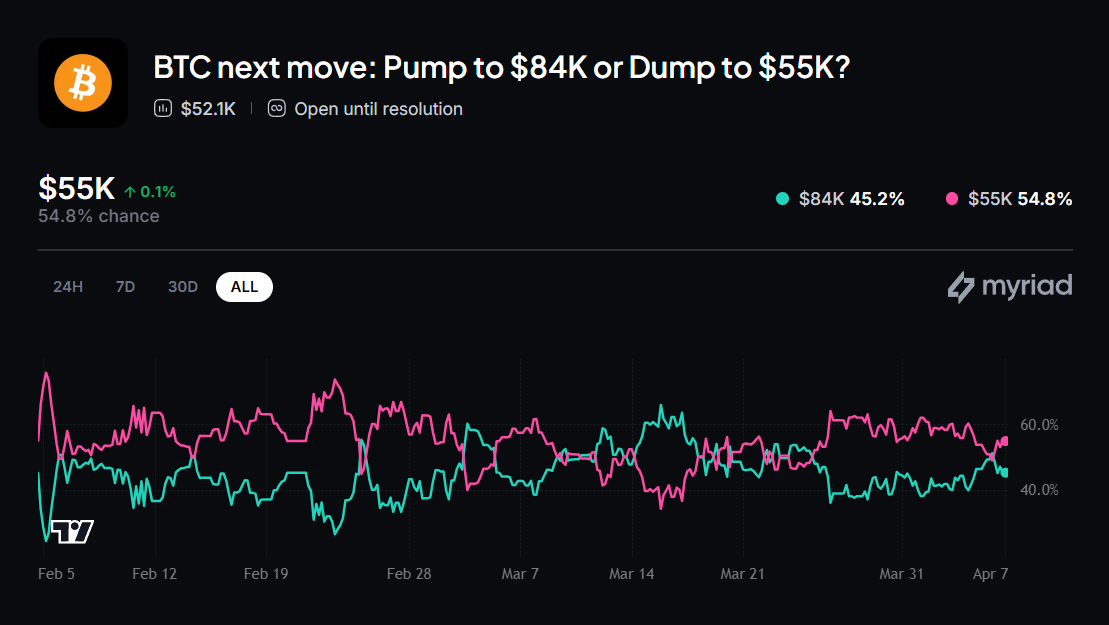
On the crypto side, Myriad users assign a 45% chance that Bitcoin's next major move is a rally to $84,000, while crude oil currently carries an 87% probability of pushing to $120 per barrel. Taken together, these figures capture the mood perfectly: growing optimism, but genuine uncertainty about whether this is the move that sticks.
What the Charts Are Saying
The Supply Wall That Bitcoin Needs to Break Through
If the macro picture explains why sentiment may have shifted, the technical picture explains exactly where Bitcoin is in its recovery. And right now, it's at a critical juncture. The UTXO Realized Price Distribution, or URPD, maps how much Bitcoin supply was last moved at each price level, essentially showing where holders' cost bases sit. Right now, an important supply cluster is sitting right at the current price range around $69,422.
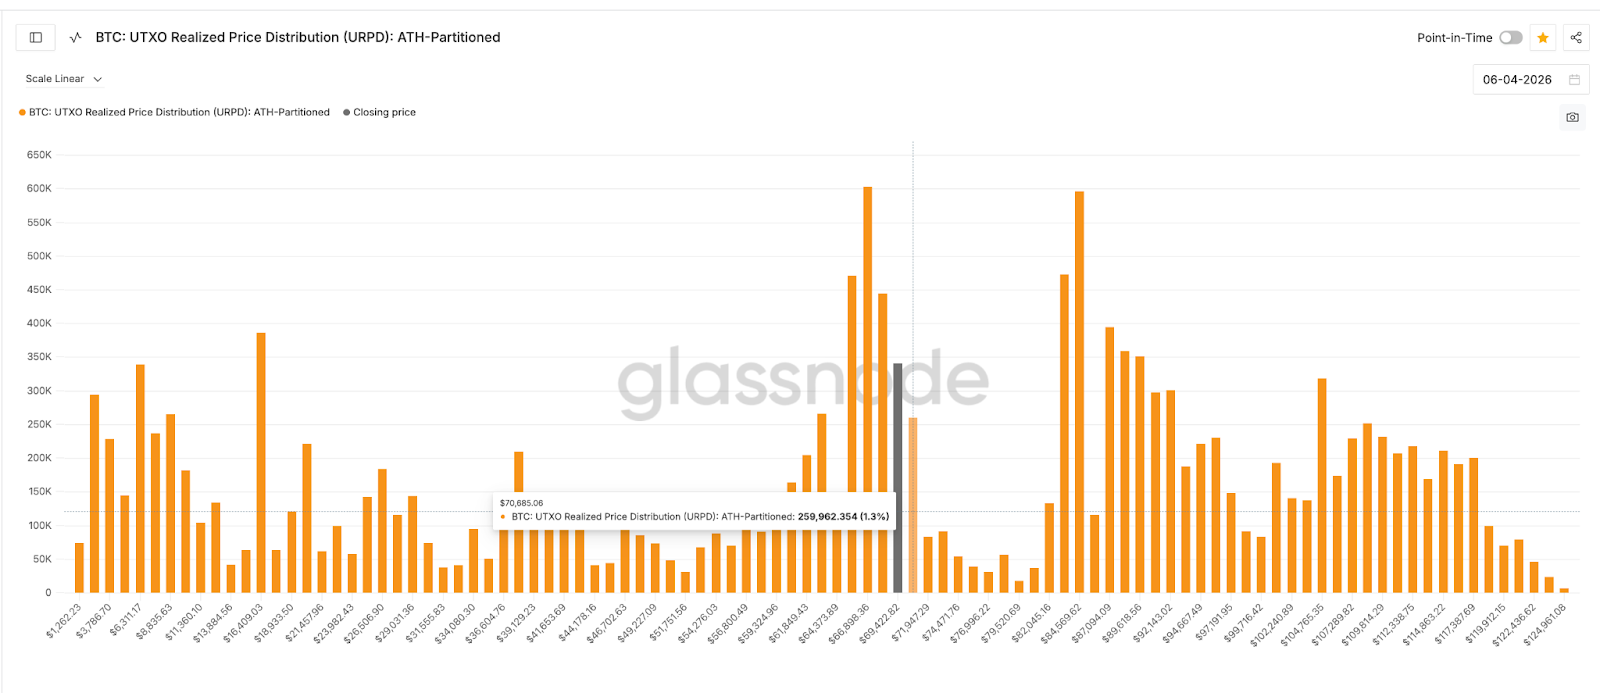
Think of it as a wall of potential sellers, all sitting at roughly breakeven, who may look to exit if price touches their entry. That's the resistance Bitcoin keeps running into.
What’s the encouraging part? Above that wall, the road clears up significantly. Supply concentration drops to 1.3% at $70,685, then thins out considerably all the way to around $84,000, where the next dense cluster appears. If Bitcoin can punch through the first wall, there's a lot of open space before the next major obstacle.
The Price Levels to Watch This Week
Here's a clean map of the key levels, both to the upside and downside:
• $69,00: The immediate hurdle. An 8-hour close above this level would signal that the supply cluster didn't sell into this rally.
• $72,000: The swing high from the March 17–25 range. A close above this confirms Bitcoin has broken out of the consolidation zone that has contained it for weeks.
• $68,600: Immediate support. The first line of defence if the rally loses momentum.
• $66,600: The key floor, tested multiple times since late March.
The Extra Catalysts
Macro optimism set the stage and the technicals provided the structure. But two additional factors acted as accelerants, turning what might have been a modest bounce into one of the more significant intraday moves in recent weeks.
A Short Squeeze Added Rocket Fuel
When ceasefire hopes hit the wires, crypto markets were sitting in "extreme fear" territory, the kind of sentiment environment where a high number of traders are betting on prices falling. That setup is what traders call spring-loaded: the worse the sentiment, the more violent the snap-back if it reverses.
And snap back it did. Over $200 million in short positions were liquidated in a single 24-hour window; four times more than long liquidations. When traders who are short a market get forced to buy back their positions at a loss, those forced purchases pile on top of organic buying and push prices up faster and further than the underlying catalysts alone would justify. This is the textbook short squeeze, and it's a significant reason why the move was as sharp as it was.
Morgan Stanley's Bitcoin ETF Is Entering the Arena
Layered on top of all of this: Morgan Stanley is launching a spot Bitcoin ETF on April 8, and it's coming in aggressively, undercutting BlackRock's market-leading IBIT fund with a 0.14% expense ratio versus IBIT's 0.25%.
When one of the world's largest wealth managers enters the Bitcoin ETF space at a competitive fee and undercuts the current market leader on price, it tells you something about where institutional conviction is heading. It also widens the on-ramp for large capital allocators who had been sitting on the sidelines.
The Bottom Line
Many forces converged on Monday to push crypto sharply higher. The result is Bitcoin testing the $70,000 resistance level once again, many altcoins posting 5–7% gains, and over $60 billion added to the total crypto market cap in 24 hours.
The market is showing real fight. Whether that fight turns into a sustained breakout depends on a few things: whether the geopolitical situation moves from hopeful reports to actual confirmation, and whether big buyers step in with conviction above $70,000. A clean close above this level is the first sign to watch for — and for that, there's no better place than the Markets Center on Tap, where you can check on your favorite cryptos and get the latest news in real time!
This article is for general information purposes only and is not intended to constitute legal, financial or other professional advice or a recommendation of any kind whatsoever and should not be relied upon or treated as a substitute for specific advice relevant to particular circumstances. We make no warranties, representations or undertakings about any of the content of this article (including, without limitation, as to the quality, accuracy, completeness or fitness for any particular purpose of such content), or any content of any other material referred to or accessed by hyperlinks through this article. We make no representations, warranties or guarantees, whether express or implied, that the content on our site is accurate, complete or up-to-date.
