
Aprender, de forma sencilla
Explora nuestros recursos, guías y artículos sobre todo lo relacionado con el dinero. Gana confianza financiera con contenidos seleccionados por nuestros expertos, tanto si estás empezando como si ya tienes experiencia.
Últimos artículos
.webp)
El viernes 7 de marzo de 2025, la Casa Blanca celebró su primera Cumbre Cripto, marcando un punto de inflexión en la forma en que el gobierno estadounidense percibe la industria de los activos digitales. El evento reunió a líderes del sector, responsables políticos y actores clave para debatir el futuro de las criptomonedas en Estados Unidos.
En este artículo analizamos qué se esperaba de la cumbre, qué ocurrió realmente y cómo ya está influyendo en el mercado cripto.
Qué se esperaba
Antes de la cumbre, la comunidad cripto mostraba un optimismo prudente. La administración Trump ya había dado señales de interés en los activos digitales, especialmente tras la aparición del presidente Trump en Bitcoin 2024, un movimiento que generó reacciones mixtas en el mercado.
Muchos inversores y líderes del sector esperaban que el encuentro trajera mayor claridad regulatoria, impulsara la innovación y corrigiera fricciones regulatorias del pasado. El entusiasmo aumentó aún más tras anunciarse una orden ejecutiva para crear una Reserva Estratégica de Bitcoin, lo que elevó las expectativas sobre un papel más relevante de Bitcoin en la economía estadounidense.
En los días previos a la reunión, el mercado cripto experimentó una subida general del 12 %, con el precio de Bitcoin superando los 92.000 dólares en anticipación al evento.
Desarrollo de la cumbre
La cumbre contó con la participación de figuras destacadas como Michael Saylor (Strategy), Brian Armstrong (Coinbase) y Brad Garlinghouse (Ripple), reflejando el compromiso de la administración por dialogar con actores clave del sector.
Uno de los momentos más relevantes fue la firma por parte del presidente Trump de una orden ejecutiva para crear una Reserva Estratégica de Bitcoin de EE. UU. El objetivo es reforzar la posición económica del país mediante la custodia de Bitcoin incautado en procesos de decomiso de activos. La iniciativa fue descrita como una especie de “Fort Knox virtual” para el oro digital, bajo la gestión del Tesoro.
Según datos de Arkham Intelligence, el gobierno estadounidense posee actualmente 198.109 Bitcoin, valorados en unos 17.500 millones de dólares según precios de mercado recientes.
La orden ejecutiva también instruye a los departamentos federales a revisar sus tenencias en criptomonedas y a explorar formas de adquirir más Bitcoin mediante estrategias “neutrales para el presupuesto”, sin generar costes adicionales para los contribuyentes.
Además, se debatió la posible creación de una Reserva de Activos Digitales que incluiría otras criptomonedas como XRP, Solana (SOL) y Cardano (ADA), con el objetivo de reforzar la credibilidad de estos activos.
Reserva Estratégica de Bitcoin vs. Reserva de Activos Digitales
El enfoque del gobierno estadounidense contempla dos iniciativas diferenciadas: la Reserva Estratégica de Bitcoin y la Reserva de Activos Digitales.
La Reserva Estratégica de Bitcoin tiene como objetivo mantener Bitcoin a largo plazo, utilizando activos ya incautados en lugar de realizar nuevas compras. Este planteamiento ha generado controversia debido a la volatilidad de Bitcoin y a su naturaleza descentralizada, que algunos consideran difícil de conciliar con el control estatal.
También existen preocupaciones sobre que una reserva basada en activos confiscados pueda derivar en tenencias motivadas políticamente, más que en una estrategia claramente definida.
Por su parte, la Reserva de Activos Digitales, también bajo la gestión del Tesoro, incluiría otras criptomonedas como Ethereum, XRP, Solana y Cardano. A diferencia de la reserva de Bitcoin, esta estructura podría permitir una mayor flexibilidad, incluyendo la posibilidad de vender activos.
Mientras que la reserva de Bitcoin busca consolidar su papel como activo estratégico, la inclusión de otras criptomonedas plantea interrogantes sobre la estrategia global del gobierno en materia de activos digitales. Muchos detalles aún permanecen sin definir.
Reacción del mercado al resultado
La reacción del mercado fue mixta. Inicialmente, el precio de Bitcoin subió impulsado por el optimismo. Sin embargo, cuando quedó claro que la Reserva Estratégica de Bitcoin se basaría únicamente en tenencias existentes y no en nuevas compras, el sentimiento cambió.
La orden ejecutiva firmada confirmó que la reserva incluiría solo Bitcoin ya en posesión del gobierno, principalmente procedente de decomisos en casos penales y civiles. Muchos participantes del mercado habían anticipado compras adicionales de Bitcoin, algo que no se materializó a corto plazo, aunque la posibilidad no quedó completamente descartada.
Esto provocó una corrección significativa del precio, con Bitcoin cayendo hasta alrededor de los 85.000 dólares antes de estabilizarse cerca de los 88.000 dólares, lo que supuso una caída superior al 3 % en 24 horas. En los días siguientes, el precio descendió por debajo de los 80.000 dólares.
Además, los ETF de Bitcoin registraron salidas de capital relevantes, con unos 370 millones de dólares retirados, mientras los inversores reevaluaban el impacto de la estrategia gubernamental. El resto del mercado cripto reflejó una volatilidad similar, mostrando la compleja relación entre anuncios de política pública y sentimiento inversor.
Navegando el futuro de la regulación cripto
La Cumbre Cripto de la Casa Blanca representó un hito en la relación entre el gobierno estadounidense y la industria de las criptomonedas. Si bien la creación de la Reserva Estratégica de Bitcoin supone un paso hacia el reconocimiento oficial de los activos digitales, la reacción del mercado dejó claro que los inversores esperan políticas más definidas y accionables.
Estados Unidos se encuentra en un momento clave para definir el futuro de las finanzas digitales. La cumbre envió una señal de apertura hacia el sector cripto, pero el verdadero reto está por venir: diseñar un marco regulatorio que fomente la innovación sin generar inestabilidad. Con el enfoque adecuado, el país podría posicionarse como líder en la evolución financiera global y sentar las bases para un futuro donde innovación y estabilidad puedan coexistir.
Imagina la escena: estás navegando por plataformas DeFi y de repente ves dos proyectos distintos. Uno anuncia a gritos “12 % APR” y otro presume de “12 % APY”. Tu cerebro probablemente piensa: “Es lo mismo, ¿no?”
Error. Y no uno pequeño.
Cuando se trata de comparar tipos de interés, APR y APY pueden parecer gemelos… pero no lo son en absoluto. La diferencia entre ambos puede marcar si tus ahorros crecen o si terminas pagando de más por un préstamo. En esta guía vamos a explicar qué significan realmente APR y APY, cómo funcionan en banca, préstamos y cripto, y por qué entenderlos te ayuda a interpretar mejor cualquier oferta.
Puntos clave
- El APR (Annual Percentage Rate) muestra el coste anual de un préstamo, incluyendo intereses y ciertas comisiones.
- El APY (Annual Percentage Yield) refleja el rendimiento anual total, teniendo en cuenta la capitalización.
- Para prestatarios, un APR más bajo implica un coste total menor. Para ahorradores, un APY más alto significa mayores ganancias.
- En cripto y DeFi, la frecuencia de capitalización puede convertir APR modestos en APY mucho más altos.
APY vs. APR: la diferencia esencial
A simple vista, el APR indica cuánto interés se paga o se gana en un año sin capitalización. El APY, en cambio, incluye la capitalización, es decir, cuando los intereses generan más intereses con el paso del tiempo.
Al comparar productos financieros, ya sea una tarjeta de crédito, una cuenta de ahorro o un pool de staking, esta diferencia importa. Para quien pide prestado, el APR revela el coste real de la deuda. Para quien busca rendimiento, el APY muestra el poder del crecimiento compuesto.
En resumen rápido: el APR habla de coste, el APY habla de crecimiento. Saber cuál estás viendo te permite comparar opciones con mayor claridad.
¿Qué es el APR (Annual Percentage Rate)?
El APR representa el tipo de interés anual que se cobra por pedir dinero prestado, o el tipo base que se obtiene al prestar, antes de aplicar capitalización. Incluye intereses y determinadas comisiones, lo que ayuda a entender el coste total del crédito.
El APR se utiliza ampliamente en tarjetas de crédito, préstamos personales, hipotecas y financiación de vehículos. Por ejemplo, si tu tarjeta tiene un APR del 18 %, pagarás ese porcentaje sobre el saldo pendiente.
Los préstamos a tipo fijo mantienen el mismo APR, mientras que los de tipo variable pueden cambiar según las condiciones del mercado.
Ejemplo: pides prestados 10.000 € a un 10 % APR durante un año. Pagarás 1.000 € en intereses. Simple, directo y sin efectos de capitalización.
¿Qué es el APY (Annual Percentage Yield)?
El APY mide cuánto crece tu dinero a lo largo de un año teniendo en cuenta la capitalización. Refleja cada cuánto se añaden los intereses al saldo, ya sea a diario, mensualmente o de forma anual, y cómo esos intereses generan nuevos intereses.
Es la métrica estándar para cuentas de ahorro, cuentas remuneradas y depósitos. Bancos y plataformas financieras suelen destacar el APY porque ofrece una visión más completa del potencial de crecimiento.
Ejemplo: depositas 10.000 € en una cuenta con un 5 % APY compuesto mensualmente. Tras un año, el saldo asciende a unos 10.511 €, ligeramente más que con un 5 % sin capitalización.
Cuanto más frecuente es la capitalización, mayor es el crecimiento, algo especialmente relevante en protocolos DeFi donde el proceso puede repetirse cada pocos minutos.
APR vs. APY según el producto financiero
Tarjetas de crédito y préstamos (enfoque en APR)
Cuando se pide dinero prestado, el APR ayuda a entender el coste real. Por ejemplo, una hipoteca con un 6,5 % APR incluye tanto el interés como ciertos gastos asociados. Préstamos personales, estudiantiles y tarjetas de crédito utilizan APR para facilitar la comparación entre entidades.
La regla general es sencilla: APR más bajo, préstamo menos costoso.
Cuentas de ahorro e inversión (enfoque en APY)
Si el objetivo es hacer crecer el dinero, el APY es la referencia. Una cuenta con un 4,5 % APY crecerá más rápido que una con un 4 %, gracias al efecto de la capitalización.
En productos como depósitos o cuentas a plazo, el APY permite comparar el impacto real de la frecuencia de capitalización.
Criptomonedas y DeFi (APR y APY juntos)
En lending, staking o yield farming, es común ver ambos términos, lo que puede generar confusión.
El APR suele mostrar la recompensa base, sin capitalización.
El APY asume que las recompensas se reinvierten de forma constante.
Ejemplo: un pool DeFi puede anunciar un 100 % APR, pero con capitalización diaria ese rendimiento se transforma en un APY mucho mayor. La clave está en entender cada cuánto se pueden reclamar recompensas y si los costes asociados hacen viable la capitalización.
Cómo calcular APR y APY
Para comparar correctamente, es posible convertir uno en el otro mediante fórmulas matemáticas.
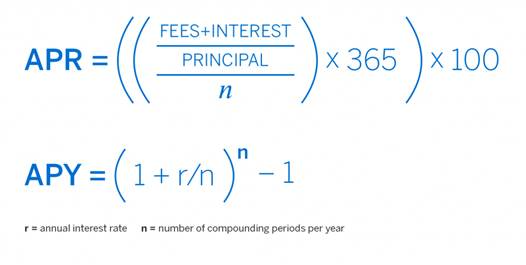
Ejemplo: un 12 % APR con capitalización mensual se convierte en un APY aproximado del 12,68 %.
Cuanto más frecuente es la capitalización, mayor será el APY resultante.
¿En cuál deberías fijarte?
- Si pides prestado, céntrate en el APR. Refleja el coste total.
- Si ahorras o buscas rendimiento, observa el APY. Muestra el efecto del interés compuesto.
- En cripto, revisa ambos. El APR indica la base, el APY muestra el potencial con reinversión.
Al comparar ofertas, conviene leer siempre los detalles: frecuencia, comisiones y condiciones pueden cambiar mucho el resultado final.
Errores comunes y consejos prácticos
Mito: “El APY siempre es mejor.”
Realidad: solo si existe capitalización o reinversión de recompensas.
Mito: “El APR no sirve porque no capitaliza.”
Realidad: el APR es clave para comparar costes de forma clara.
Consejo: usar calculadoras online de APR a APY facilita las comparaciones y elimina conjeturas.
Conclusión
APR y APY no son dos formas distintas de decir lo mismo. Representan enfoques diferentes para medir rendimientos y costes.
Cuando ves APR, estás viendo interés simple calculado a lo largo de un año. Cuando ves APY, estás viendo el efecto de la capitalización en el tiempo.
La diferencia se vuelve más evidente cuanto más altos son los porcentajes. A mayor tipo base, mayor será la distancia entre APR y APY.
Entender cuál estás observando te permite comparar opciones con mayor precisión. El APR muestra el punto de partida; el APY muestra lo que puede suceder cuando los rendimientos se acumulan.
Una vez que distingues ambos conceptos, muchas ofertas financieras dejan de parecer confusas. Los números empiezan a tener sentido y las comparaciones se vuelven mucho más claras.
¿Recuerdas cuando tus abuelos presumían de una cuenta de ahorro al 2 %? Hoy eso suena a otra época, especialmente cuando en cripto aparecen cifras de APY que harían palidecer a cualquier banquero tradicional. Pero antes de soñar con jubilarte el mes que viene gracias a esos rendimientos tan llamativos, conviene entender qué significa realmente el APY y por qué algunos números parecen sacados de un boleto de lotería.
¿Qué es el APY, en realidad?
Piensa en el APY como el interés compuesto llevado al siguiente nivel. Mientras una cuenta bancaria tradicional apenas se mueve, el APY mide cuánto puede crecer tu saldo en un año cuando los intereses se acumulan sobre intereses. Aquí es donde la idea de “que tu dinero trabaje solo” cobra sentido.
Un pequeño ejercicio de realidad: coloca 1.000 € en un banco con un 5 % de interés simple y al final del año tendrás 1.050 €. Predecible.
Ese mismo importe con un 5 % de APY, compuesto mensualmente, se convertiría en 1.051,16 €.
“Solo un euro más”, podrías pensar. La diferencia aparece con el tiempo. El interés compuesto crea una bola de nieve que no deja de crecer. No son céntimos: es el tipo de efecto que, con el paso del tiempo, marca distancia.
APY vs. APR: la rivalidad que conviene entender
Vale, confesión: incluso gente con experiencia en cripto los mezcla. Aquí tienes la chuleta:
APY (Annual Percentage Yield): lo que puedes ganar cuando prestas o pones a trabajar tus criptomonedas, teniendo en cuenta el interés compuesto.
APR (Annual Percentage Rate): lo que pagas cuando pides prestado, normalmente sin considerar la capitalización.
Piénsalo así: el APY es el que te “trae” rendimiento; el APR es el que te “cuesta” rendimiento.
Para una comparación más detallada, haz clic aquí.
¿Dónde aparece el APY en cripto?
“Cuentas de ahorro” cripto
Algunas plataformas te permiten depositar tokens y ver cómo crecen. Es como poner tus criptomonedas a trabajar en un empleo que sí paga. Tus activos se prestan a traders que los necesitan y tú recibes una parte.
Staking: conviértete en validador de la red
En blockchains con Proof of Stake como Ethereum o Cardano, puedes hacer staking de tus tokens para ayudar a asegurar la red. Es como ser un “vigilante digital” que cobra en cripto: la red se mantiene segura y tú recibes recompensas.
Yield farming: el Lejano Oeste de DeFi
Aquí es donde la cosa se pone interesante… y un poco salvaje. Aportas liquidez a exchanges descentralizados y, a cambio, ganas comisiones de trading más tokens de gobernanza. A veces aparecen APY que parecen números de teléfono, pero suelen bajar rápido. Estos rendimientos tienen fama de aterrizar de golpe.
Protocolos de lending: conviértete en el banco
Plataformas como Aave y Compound te dejan jugar a ser banco. Prestas tus tokens, los prestatarios pagan intereses y tú cobras. El APY sube cuando mucha gente quiere pedir prestado ese activo y baja cuando la demanda se enfría.
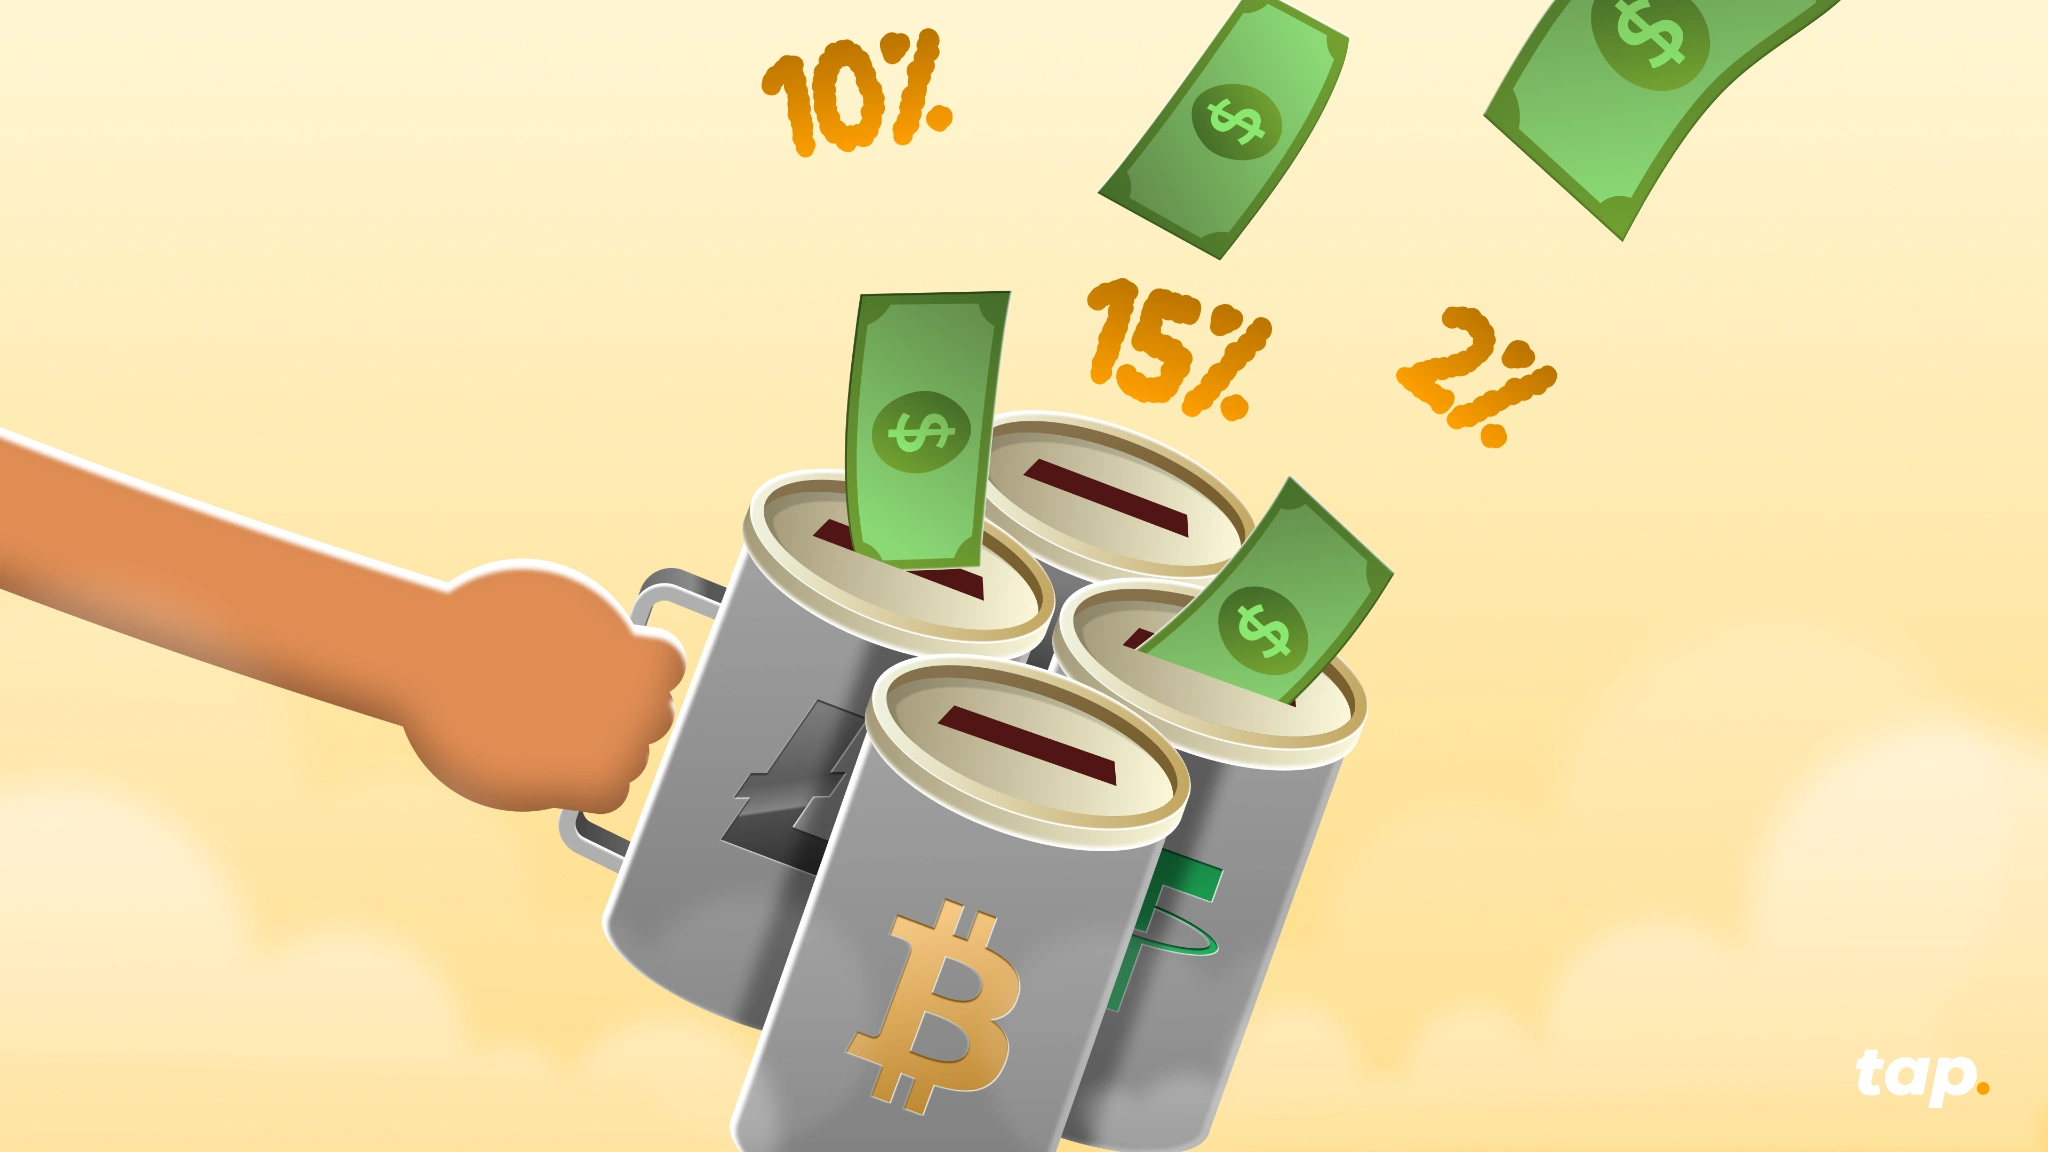
¿Por qué los APY en cripto son tan altos?
Mientras un banco te ofrece un 0,5 % (si tienes suerte), en cripto puedes ver cifras como 10 %, 50 % o incluso 1.000 %+. ¿Por qué?
- Los traders pagan primas altas para abrir cortos o ejecutar estrategias complejas de arbitraje. Pura oferta y demanda.
- Los proyectos nuevos suelen “tirar de APY” para atraer liquidez. Es como una promo de lanzamiento, pero con más ceros.
- El riesgo va incluido. En cripto hay más incertidumbre, y los rendimientos reflejan esa montaña rusa.
- Los incentivos en tokens inflan muchas cifras. Parte del APY puede venir en tokens del proyecto, cuyo valor puede subir… o desplomarse.
Las matemáticas detrás de la magia
Tranquila, no vamos a convertir esto en una pesadilla de cálculo. La fórmula del APY es bastante simple:
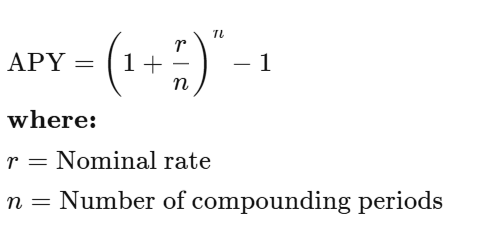
Ejemplo: un 10 % de interés compuesto mensualmente da alrededor de un 10,47 % de APY. ¿Compuesto a diario? Aproximadamente 10,52 %. En cripto, algunos protocolos componen por bloque, casi cada pocos segundos. Tu calculadora podría empezar a sufrir.
La letra pequeña
Antes de dejar tu trabajo y declararte “yield farmer” profesional, toca hablar de lo que no suele salir en las conversaciones con entusiasmo.
Primero, la volatilidad. Puedes ver un APY del 20 %, pero si el token cae un 50 %, el resultado final cambia por completo.
Luego está la pérdida impermanente, que puede morder tus ganancias cuando aportas liquidez y los precios se mueven.
Y ojo con el riesgo de contratos inteligentes. En DeFi, el dinero vive dentro de código, y si algo falla, los fondos pueden evaporarse sin despedida.
También existe riesgo de plataforma. Casos como Celsius o FTX demostraron que, a veces, el problema no es el mercado, sino la propia entidad.
Y por último: el “latigazo” del APY. Ese 100 % que viste ayer puede ser 15 % hoy. En cripto, los tipos cambian rápido por demanda, competencia, tokenomics… o simplemente porque el mercado gira.
¿Qué es un “buen” APY?
Conservador. Activos más consolidados y plataformas conocidas: 3 % a 8 %. Para quien prefiere menos sobresaltos.
Moderado. Staking de ciertos altcoins o liquidez: 10 % a 20 %. Emoción contenida.
Alto (YOLO). Proyectos nuevos en DeFi: 50 % a 100 %+… con una posibilidad real de que el riesgo sea igual de alto que el porcentaje.
Si un APY parece demasiado bueno para ser verdad, normalmente viene acompañado de riesgos igual de “creativos”.
Bola de cristal: el futuro del APY en cripto
Aquí cambia el tono. A medida que cripto madura, los APY se están pareciendo menos a boletos de lotería y más a productos financieros de verdad. Entran instituciones, hay más supervisión y el “Lejano Oeste” se va convirtiendo en una ciudad con normas.
Es probable que cripto siga ofreciendo rendimientos más atractivos que la banca tradicional, pero los días de 10.000 % de APY parecen cada vez más un recuerdo.
Conclusión
El APY en cripto es el mismo concepto matemático de siempre, pero con ropa digital y dinámicas distintas. Ya sea staking, lending o yield farming, entender el APY te ayuda a separar oportunidades reales de promesas dudosas.
El APY no es un truco para generar dinero infinito. Es una métrica que puede ayudarte a entender cómo crecen los rendimientos, pero siempre dentro de un entorno con riesgos.
Y vale la pena recordar esto: el mejor APY del mundo no sirve de nada si el proyecto desaparece del mapa. Elige con criterio, diversifica con cabeza y que el interés compuesto te trate bien.

Audius es uno de los proyectos más interesantes del ecosistema Web3. Se trata de una plataforma de streaming musical descentralizada creada para devolver el poder a los artistas. En lugar de depender de discográficas o plataformas centralizadas, Audius conecta directamente a los creadores con sus fans, permitiéndoles publicar, compartir y monetizar su música en sus propios términos. Es una plataforma donde los oyentes pueden escuchar música libremente, mientras que los artistas obtienen recompensas en la criptomoneda nativa de la plataforma, AUDIO.
Fundada en 2018 por Roneil Rumburg y Forrest Browning, Audius ha atraído a millones de usuarios mensuales y a cientos de miles de artistas, con el respaldo de grandes nombres como Katy Perry, Nas, Steve Aoki y Jason Derulo. Su misión es clara: eliminar intermediarios y permitir que los artistas sean verdaderos propietarios de su trabajo y se beneficien directamente de él.
¿Cómo funciona Audius?
A nivel técnico, Audius opera sobre una red descentralizada impulsada por nodos de contenido y nodos de descubrimiento.
Los nodos de contenido alojan y protegen los archivos musicales en nombre de los artistas, mientras que los nodos de descubrimiento los indexan para que los fans puedan encontrar fácilmente las canciones. Este sistema sustituye a los servidores centralizados por una red distribuida, ofreciendo mayor resistencia a la censura y más transparencia.
Los artistas pueden subir música directamente a Audius, decidir cómo compartirla (gratis o de pago) e incluso desbloquear contenido exclusivo para sus fans más fieles. A diferencia de las plataformas tradicionales que pagan únicamente por número de reproducciones, Audius recompensa a los artistas en función del compromiso global: canciones en tendencia, subidas verificadas e interacción con la comunidad.
Aunque Audius se construyó originalmente sobre la blockchain de Ethereum, posteriormente migró su sistema de contenidos a Solana para ofrecer transacciones más rápidas y económicas, manteniendo AUDIO como un token ERC-20. Esta configuración híbrida combina la fiabilidad de Ethereum con la escalabilidad de Solana.
¿Qué hace diferente a Audius?
Audius desafía las normas de la industria musical invirtiendo la estructura de beneficios. En el streaming tradicional, los artistas suelen recibir alrededor del 12 % de los ingresos totales. En Audius, los artistas reciben el 90 % de las recompensas directamente en tokens AUDIO, mientras que el 10 % restante se destina a los operadores de nodos que ayudan a asegurar la red.
Este enfoque crea un modelo más transparente y equitativo, que permite a los artistas conectar directamente con sus oyentes, lanzar contenidos exclusivos o gestionar sus propias comunidades. Además, la plataforma colabora con TikTok, permitiendo enlazar canciones de Audius directamente a vídeos, lo que amplía su exposición en redes sociales convencionales.
Gracias al almacenamiento descentralizado (a través de AudSP, un sistema basado en IPFS), los artistas mantienen el control sobre sus archivos musicales. Esto convierte a Audius en una plataforma resistente a la censura y realmente orientada a los creadores, algo poco habitual en el mundo del streaming.
El token AUDIO
El token AUDIO es el pilar del ecosistema Audius y cumple varias funciones clave:
- Staking y seguridad de la red: los operadores de nodos hacen staking de AUDIO para ejecutar la infraestructura y ganar recompensas.
- Gobernanza: cada token AUDIO otorga un voto en las decisiones del protocolo, dando a la comunidad voz sobre la evolución de la plataforma.
- Acceso a funciones: mantener o hacer staking de AUDIO desbloquea funciones premium, acceso anticipado a nuevas herramientas e insignias para artistas.
AUDIO tiene una oferta inicial de mil millones de tokens y se utiliza para recompensas de la plataforma, incentivos comunitarios y la seguridad continua de la red. Los holders también pueden ganar AUDIO adicional mediante staking o contribuyendo al crecimiento del ecosistema.
Por qué Audius es importante
Audius es mucho más que una app de música: es una prueba real de cómo la blockchain puede transformar las industrias creativas. En resumen, ofrece:
- Conexión directa entre artistas y fans sin intermediarios
- Reparto de ingresos transparente mediante recompensas on-chain
- Almacenamiento resistente a la censura para música y metadatos
- Escalabilidad cross-chain con interoperabilidad entre Ethereum y Solana
Para los artistas, supone un trato más justo. Para los oyentes, es una forma de apoyar directamente a los creadores y descubrir nuevas comunidades musicales impulsadas por crypto.
Conclusión
Audius reimagina lo que podría ser el streaming musical en la era Web3: un ecosistema justo, abierto y descentralizado donde creatividad y propiedad van de la mano. Une tecnología blockchain y expresión cultural, demostrando que la descentralización no es solo cosa de las finanzas.
Dónde conseguir AUDIO
¿Te interesa el proyecto? Puedes adquirir el token AUDIO en plataformas como Tap.

2025 ha sido un punto de inflexión para la inteligencia artificial. GPT-5 de OpenAI y Claude Sonnet 4.5 de Anthropic han vuelto a elevar el listón, cada uno con el objetivo de integrar un razonamiento más sólido, mayor memoria y más autonomía en un solo sistema coherente.
Ambos están diseñados para abordar programación, investigación, redacción y tareas a escala empresarial, pero sus filosofías de diseño difieren de forma clara. Este análisis compara su rendimiento en razonamiento, programación, matemáticas, eficiencia y coste para ayudarte a decidir dónde brilla cada uno.
Visión general rápida
Claude Sonnet 4.5 se apoya en la familia Claude de Anthropic, ya consolidada. Amplía la memoria entre sesiones, gestiona contextos de hasta un millón de tokens a través de Amazon Bedrock y Vertex AI, e incorpora una gestión inteligente del contexto que evita cortes bruscos. Además, puede operar de forma autónoma durante hasta 30 horas en tareas prolongadas, lo que lo hace ideal para flujos de trabajo continuos.
GPT-5, por su parte, es el modelo insignia de OpenAI tras GPT-4, optimizado para el razonamiento agentic, donde el modelo planifica, ejecuta y coordina herramientas por sí mismo. Su sistema de razonamiento adaptativo decide dinámicamente entre rutas de pensamiento superficial o profundo, permitiendo equilibrar velocidad, coste y profundidad según la tarea. GPT-5 también ofrece variantes especializadas (Mini y Nano) para cargas de trabajo más ligeras.
Razonamiento y análisis
Ambos modelos superan ampliamente a sus versiones de 2024, pero difieren en cómo razonan.
El modo de razonamiento profundo de GPT-5 mejora de forma notable el rendimiento en tareas de lógica compleja, científicas y espaciales. Es capaz de dividir problemas en cadenas de razonamiento, probar subhipótesis y autocorregirse durante el proceso. Sin embargo, cuando este modo se desactiva, la precisión disminuye de forma significativa. Puede ser brillante cuando “piensa a fondo”, pero más variable cuando no lo hace.
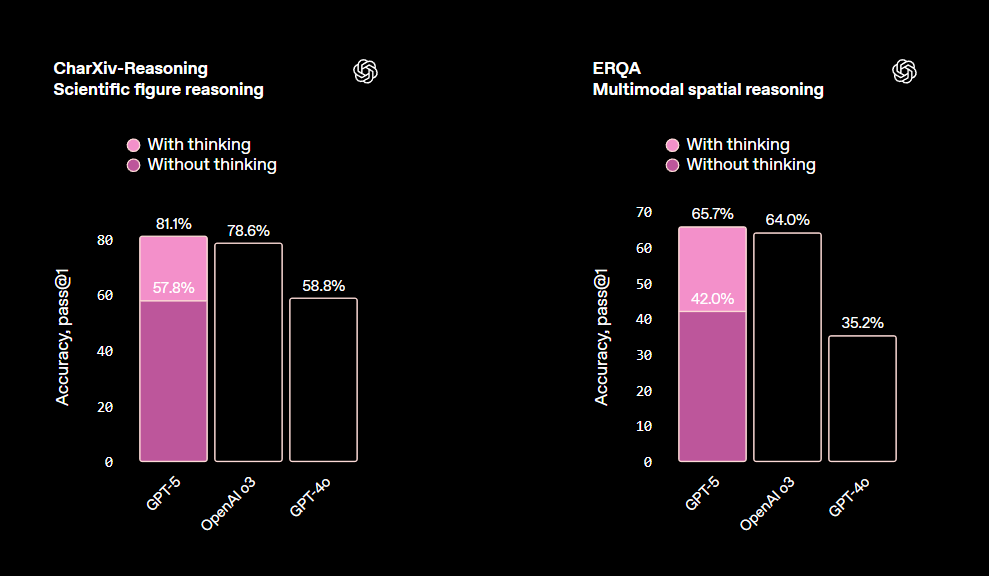
Claude Sonnet 4.5, en cambio, mantiene una estabilidad notable incluso sin configuraciones adicionales. Destaca especialmente en lógica financiera, normativa y empresarial, donde la estructura y la coherencia pesan más que los saltos creativos. Para preguntas corporativas o apoyo a la toma de decisiones, esa previsibilidad es una gran ventaja.

Si buscas un razonamiento constante y fiable, Claude lleva la delantera. Si necesitas lógica exploratoria, como pruebas de hipótesis complejas o síntesis entre dominios, la profundidad de GPT-5 no tiene rival.
Matemáticas y resolución de problemas estructurados
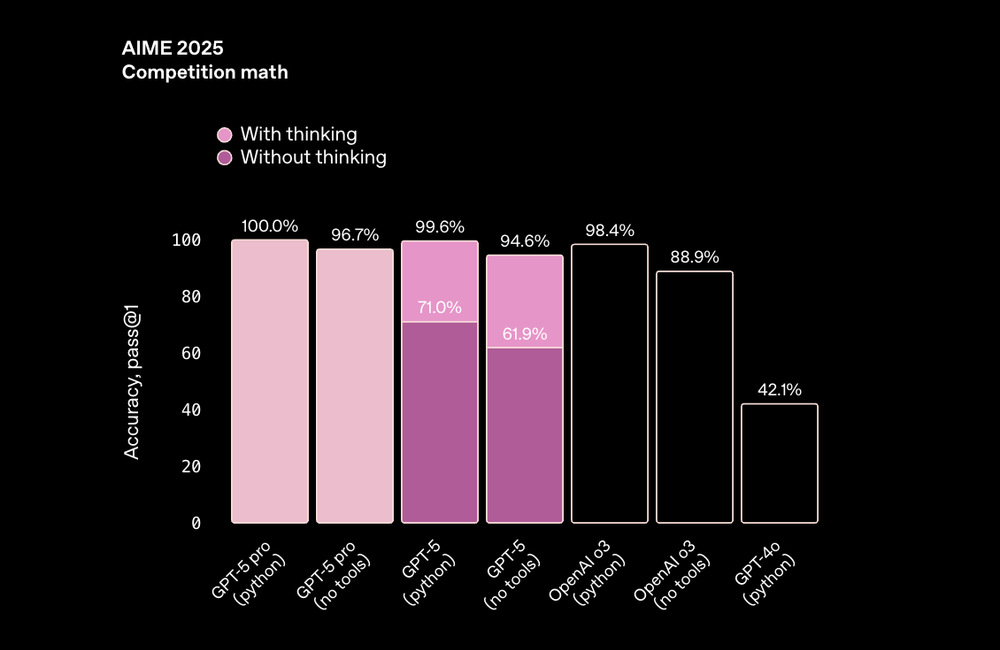
Según los benchmarks publicados por Anthropic, Claude Sonnet 4.5 mantiene su racha de consistencia. Ya sea calculando directamente o utilizando herramientas como Python, alcanza una precisión matemática de primer nivel, incluso en entornos restringidos.
GPT-5 también logra una precisión casi perfecta, pero solo cuando el uso de herramientas y la profundidad de razonamiento están activados. Si se deshabilitan, los resultados caen de forma notable. Depende en gran medida de su pipeline de razonamiento para mantenerse preciso.
Veredicto:
- Claude Sonnet 4.5: solucionador matemático fiable desde el primer momento.
- GPT-5: flexible, pero requiere ajustes para rendir al máximo.
Programación e ingeniería de software
En programación, los dos modelos adoptan enfoques distintos.
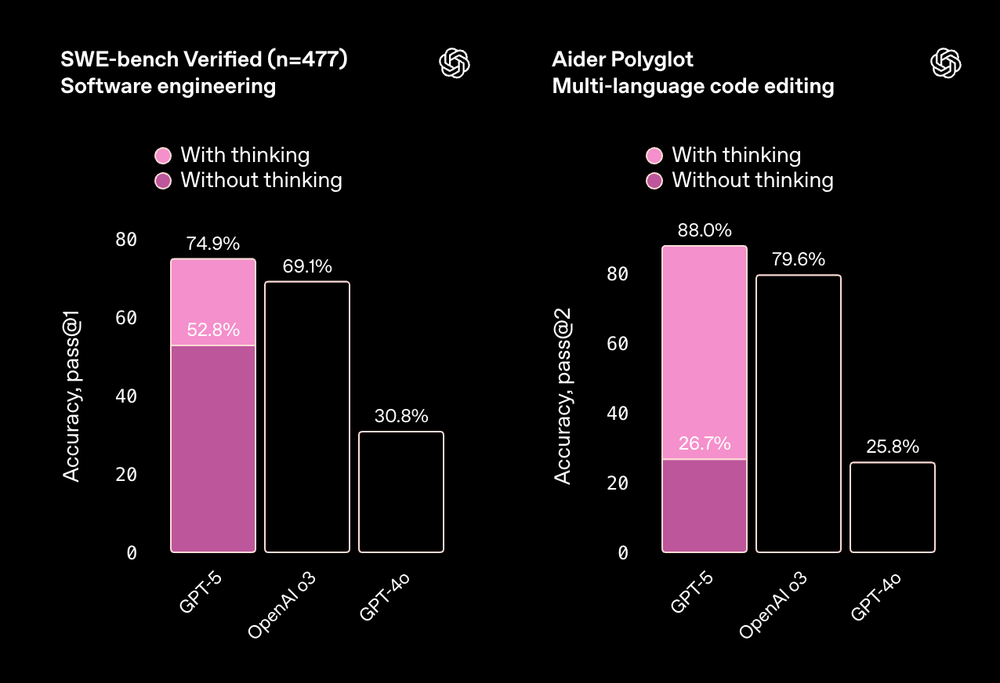
Claude Sonnet 4.5 ofrece un rendimiento estable sin necesidad de configuraciones especiales. En pruebas similares a HumanEval+ y MBPP+, mantiene una alta precisión en distintas condiciones, lo que lo hace fiable para entornos de producción. Su fortaleza es la consistencia: los resultados rara vez fluctúan, algo crucial a nivel empresarial.

GPT-5, en cambio, alcanza puntuaciones máximas más altas cuando se activa su razonamiento avanzado, especialmente en proyectos grandes o multilenguaje. En tareas de refactorización en JavaScript y Python, superó a Sonnet cuando su modo de alto razonamiento estaba activo, aunque las ejecuciones base sin ese modo mostraron mayor variabilidad.
Para programación agentic, donde la IA interactúa con herramientas externas o terminales, Sonnet 4.5 suele ejecutar con menos comandos fallidos. GPT-5, por su parte, puede encadenar más llamadas a herramientas simultáneamente, lo que lo hace más adecuado para orquestaciones complejas, siempre que esté bien configurado.
Veredicto:
- Claude Sonnet 4.5: socio de ingeniería predecible y constante.
- GPT-5: potencia versátil, pero su rendimiento depende de la configuración.
Coste y eficiencia
GPT-5 es claramente más económico por token, especialmente en entradas grandes. Su enrutador adaptativo también ahorra recursos al ejecutar prompts simples por rutas más ligeras.
Claude Sonnet 4.5 es más caro, pero ofrece una latencia predecible, un factor clave en entornos de producción que priorizan la fiabilidad frente a ahorros marginales. En prompts muy largos, su coste aumenta más rápido que el de GPT-5, aunque los descuentos por lotes reducen esa diferencia.
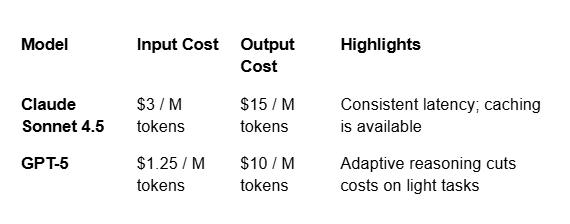
TL;DR: GPT-5 gana en precio y escalabilidad, mientras que Claude destaca por consistencia y estabilidad en tiempos de respuesta.
Precios de los planes premium
Más allá del acceso por API, tanto OpenAI como Anthropic ofrecen suscripciones premium para usuarios individuales.
ChatGPT Plus, impulsado por GPT-5, cuesta 20 dólares al mes e incluye acceso prioritario a GPT-5, respuestas más rápidas y acceso anticipado a nuevas funciones y memoria. La experiencia unificada de ChatGPT también incorpora subida de archivos, generación de imágenes y GPTs personalizados.
Claude Pro, por su parte, también cuesta 20 dólares al mes y da acceso a Claude Sonnet 4.5, con respuestas más rápidas, mayores límites de uso y ventanas de contexto más largas. Aunque carece de herramientas multimodales integradas, se centra en claridad textual y razonamiento estructurado, lo que resulta atractivo para investigadores, analistas y escritores que priorizan la fiabilidad.
TL;DR: ambos planes Plus tienen el mismo precio; lo que los diferencia es la propuesta de valor.
Fortalezas distintas para necesidades distintas
Es tentador declarar un “ganador”, pero GPT-5 y Claude Sonnet 4.5 responden a prioridades diferentes según el usuario o el equipo.
- Claude Sonnet 4.5: ideal para fiabilidad y rendimiento sostenido. Si buscas resultados consistentes y una gestión clara de la memoria, Claude cumple.
- GPT-5: ideal para profundidad, flexibilidad y escalabilidad. Bien configurado, supera a sus competidores en razonamiento creativo, integración multimodal y uso adaptativo de herramientas.
Muchos equipos descubren que la mejor estrategia es multimodelo: usar Claude donde la consistencia es clave y GPT-5 para flujos de trabajo intensivos en datos.
En última instancia, ya no hablamos solo de chatbots, sino de colaboradores digitales completos, cada uno con su propia personalidad. Claude Sonnet 4.5 es el analista tranquilo y metódico. GPT-5 es el polígrafo ambicioso. La elección depende menos de los benchmarks individuales y más de tu objetivo final.

A medida que te familiarizas con la industria de las criptomonedas, irás incorporando nuevas expresiones a tu vocabulario. Una de ellas es HODL. Aunque no es un término utilizado en las finanzas tradicionales, veremos por qué HODL se ha convertido en una parte tan valorada del ecosistema cripto. En este artículo exploramos el origen de este famoso término, qué significa y por qué todo trader de criptomonedas debería entender este concepto.
¿Qué significa HODL?
HODL se refiere a mantener una criptomoneda específica durante un largo periodo de tiempo con el objetivo de beneficiarse de la subida de su precio. En años recientes, parte de la comunidad cripto ha convertido el término en el acrónimo “Hold On for Dear Life” (aguanta con todas tus fuerzas), aunque esto no forma parte de su origen real.
HODL se ha vuelto sinónimo de no vender una criptomoneda durante un mercado bajista o en periodos de alta volatilidad. El término ha sido ampliamente adoptado por la comunidad cripto y se utiliza en contenidos de todo tipo y en todas las plataformas.
¿De dónde viene HODL?
HODL apareció por primera vez en un foro de BitcoinTalk en 2013, cuando un usuario llamado GameKyuubi escribió mal la palabra “hold”. En estado de ebriedad, publicó el siguiente mensaje:
“I type d that tyitle twice because I knew it was wrong the first time. Still wrong. w/e,” escribió GameKyuubi sobre el ahora famoso error ortográfico de “holding”. “WHY AM I HODLING? I'LL TELL YOU WHY,” continuó. “It's because I'm a bad trader and I KNOW I'M A BAD TRADER. Yeah you good traders can spot the highs and the lows pit pat piffy wing wong wang just like that and make a millino bucks sure no problem bro.”
En 2013, el precio de Bitcoin atravesó un periodo de gran volatilidad, subiendo de 130 dólares en abril a 950 dólares en diciembre. El usuario animaba a otros inversores de Bitcoin a no vender y, en su lugar, “hodlear”.
En menos de una hora, el término se convirtió en un meme ampliamente difundido y, más de una década después, sigue utilizándose.
HODL como estrategia de trading
En la inversión en criptomonedas, la volatilidad de precios es una constante. Sin embargo, el concepto de HODL ofrece una forma estratégica de afrontar estas fluctuaciones. HODL implica mantener tus inversiones durante un periodo prolongado, independientemente de los movimientos de precio a corto plazo. A pesar de las subidas y bajadas del mercado, esta estrategia puede aportar estabilidad y generar beneficios a largo plazo. Permite a los inversores navegar la volatilidad con paciencia y confianza en el crecimiento futuro.
Este enfoque ha sido adoptado por una gran parte de la comunidad de Bitcoin y del ecosistema cripto en general como una forma de generar ganancias. Para los maximalistas de Bitcoin, HODL es casi un estilo de vida. Muchos utilizan esta estrategia para evitar decisiones que erosionen beneficios, como reaccionar al FUD (miedo, incertidumbre y duda) o al FOMO (miedo a quedarse fuera), conceptos que veremos a continuación.
¿Cuándo es el mejor momento para hacer HODL?
De forma similar al proverbio chino “El mejor momento para plantar un árbol fue hace 20 años. El segundo mejor momento es ahora”, el mejor momento para hacer HODL es ahora. Como estrategia de inversión, comprar y mantener un activo suele considerarse rentable a largo plazo, ya que su valor tiende a crecer con el tiempo.
HODL es también una creencia ideológica en el potencial a largo plazo de la tecnología blockchain, las criptomonedas y las comunidades que se han formado en torno a ellas. Algunos traders del mercado bursátil han adoptado esta mentalidad, aunque el término HODL sigue utilizándose principalmente en el contexto cripto.
Otros términos cripto importantes que debes conocer
A medida que amplíes tu vocabulario cripto, es probable que te encuentres con los siguientes términos:
BTFD (buy the f*ing dip)
Término coloquial usado frecuentemente en Twitter. BTFD anima a los traders a comprar cuando los precios están bajos, con la intención de obtener beneficios cuando se recuperan.
FUD (fear, uncertainty, doubt)
Como se mencionó anteriormente, FUD se refiere a la difusión de información negativa o engañosa que suele incentivar a los traders a vender.
FOMO (fear of missing out)
Creadores de contenido o medios tradicionales pueden utilizar el FOMO para incitar a la compra de una criptomoneda, apelando al miedo de perderse grandes ganancias o “la próxima gran oportunidad”.
Lambo
Abreviatura de Lamborghini. Hace referencia a que el precio de un activo suba tanto que el usuario pueda venderlo y comprar este coche de lujo. “When Lambo?” es una frase común para preguntar cuándo el precio alcanzará ese nivel.
To The Moon
Se utiliza para describir precios que alcanzan niveles extraordinariamente altos, como si fueran rumbo a la luna.
Whale
Una ballena cripto es una persona u organización que posee una gran cantidad de una criptomoneda específica, generalmente alrededor del 10% de su suministro total.
Reflexión final
HODL hace referencia a una estrategia de comprar y mantener que nació a partir de un error tipográfico en un foro de BitcoinTalk en 2013. El concepto sigue siendo relevante más de una década después, con muchos traders y maximalistas que continúan utilizándolo. El objetivo del HODL es beneficiarse de grandes subidas de precio y reducir el impacto de los mercados volátiles.


