
Learning the friendly way
Dive into our resources, guides, and articles for all things money-related. Grow your financial confidence with our experts curated tips and articles for both experienced and new investors.
LATEST ARTICLEs

Tether är en av de fem största kryptovalutorna i världen och den mest populära stablecoinen på marknaden. Med ett av de högsta dagliga handelsvolymerna är Tether en självklar del av kryptolandskapet. Låt oss ta en närmare titt på denna digitala valuta och vad som gör Tether så central i ekosystemet.
Sedan den digitala ekonomin tog fart har användningen av internetbaserade pengar vuxit enormt — samtidigt som farhågorna också gjort det. Traditionella investerare är ofta skeptiska till volatiliteten på kryptomarknaden, men för många runt om i världen har kryptovalutor öppnat upp tillgång till finansiella tjänster som tidigare krävde långa bankprocesser.
Digitala valutor som Tether kan dessutom bidra med både transparens och säkerhet, vilket direkt bemöter några av de problem som traditionella valutor brottas med. Även om vissa kritiker fortfarande betraktar kryptovalutor som riskabla, är det tydligt att denna nya generation av betalningslösningar har tillfört något nytt och användbart till ett annars åldrat system.
Vad är Tether (USDT)?
Tether (USDT) är en kryptovaluta som är kopplad till den amerikanska dollarn — det som kallas en stablecoin. Stablecoins är digitala valutor som är bundna till ett fiatvärde, oftast på en 1:1-nivå.
Tether var faktiskt världens första stablecoin när den lanserades 2014 under namnet Realcoin. Initialt fungerade den via Omni Layer på Bitcoin-blockkedjan, men har sedan dess blivit kompatibel med flera andra blockkedjor, däribland Ethereum, TRON, EOS, Algorand, Solana och OMG Network.
För att hålla värdet stabilt är det avgörande att utbudet av Tether alltid motsvaras av tillgångar som hålls i reserv. Dessa reserver kan bestå av exempelvis kommersiella värdepapper, insättningar, kontanter, återköpsavtal och statsobligationer.
Det har förekommit spekulationer kring exakt hur dessa reserver är sammansatta, men detta har inte hindrat Tether från att fortsätta vara en av de mest använda stablecoins på marknaden.
Grundidén med Tether är enkel: att erbjuda en digital tillgång med stabilt marknadsvärde, så att användarna kan dra nytta av blockkedjans teknik och fördelar utan den prisvolatilitet som är vanlig hos många andra kryptovalutor. Om du vill fördjupa dig ännu mer, kan du alltid besöka Tethers officiella sida.
Vad är värdet på Tether?
Till skillnad från andra kryptovalutor, vars värde bestäms av tillgång och efterfrågan, är stablecoins som Tether alltid kopplade till en fiatvaluta eller råvara. För Tethers del innebär det att 1 USDT alltid motsvarar värdet av 1 amerikansk dollar.
Trots att värdet hålls stabilt har Tether vuxit till att bli en av de mest handlade kryptovalutorna i världen — något som tydligt visar på efterfrågan efter stabilitet i en annars volatil marknad.
Vem skapade Tether?
Som nämnts ovan lanserades Tether under namnet Realcoin år 2014 av Bitcoin-investeraren Brock Pierce, entreprenören Reeve Collins, och mjukvaruutvecklaren Craig Sellars. Kort därefter bytte projektet namn till USTether, och senare till det vi känner till idag som USDT.
De tre grundarna är alla välkända profiler inom kryptobranschen och har varit inblandade i flera andra projekt inom blockchain och digitala valutor.
Utöver USDT har teamet även tagit fram andra stablecoins, som exempelvis EURT (kopplad till euron), CNHT (kopplad till den kinesiska yuanen), och XAUT (kopplad till guld). Dessa hjälper till att hantera prisvolatilitet på flera olika marknader.
Hur fungerar Tether?
Tether har inte någon egen blockkedja utan fungerar som en så kallad second-layer token ovanpå redan etablerade blockkedjor som Bitcoin, Ethereum, EOS, Tron, Algorand, Bitcoin Cash och OMG.
USDT fungerar som andra kryptovalutor och lagras i plånböcker som är specifika för den blockkedja den är byggd på. Det är viktigt att tänka på att du inte kan skicka en USDT-token som är baserad på Ethereum till en plånbok som är skapad för Tron — det måste alltid ske inom samma blockkedja, annars riskerar du att förlora dina tokens.
Utbudet av Tether måste alltid vara uppbackat av motsvarande mängd tillgångar i reservkonton. Dessa reserver kan inkludera kontanter, likvida tillgångar, eller andra finansiella tillgångar.
Genom att erbjuda en stabil digital valuta i en annars volatil marknad, gör Tether det möjligt att genomföra USD-transaktioner globalt utan att oroa sig för snabba prisförändringar. Tether används också ofta som ett tryggt alternativ när marknaderna skakar till, och fungerar därmed som ett slags skyddsnät.
Vad är USDT?
USDT är Tethers stablecoin, knutet till den amerikanska dollarn i förhållandet 1:1. Under varumärket Tether är det idag världens mest använda stablecoin.
Även om det teoretiskt sett finns ett obegränsat antal USDT, låg cirkulerande mängd vid skrivande stund runt 72,5 miljarder tokens.
USDT fungerar som en trygg tillflykt för användare som vill undvika prisfall i kryptomarknaden, och erbjuder en stabil lösning utan att behöva sälja sina digitala tillgångar till traditionella valutor.
Hur köper man USDT?
Vill du lägga till Tether (USDT) i din kryptoplånbok? Det gör du enkelt genom Tap-appen. Efter en snabb verifiering får du tillgång till en rad kryptomarknader och kan lagra dina digitala tillgångar i våra integrerade kryptoplånböcker.
Med Tap-appen kan du dessutom hantera både din kryptoportfölj och fiat, när du är på språng. Du kan även använda ditt Tap-förbetalda kort för betalningar hos över 40 miljoner butiker världen över.

What is Return on Investment?
Return on investment is one of the most common measures of profitability and performance in both business and personal finance. It shows how much gain or loss you’ve made on an investment compared to its original cost.
In simple terms, ROI tells you whether your money has worked for you or not. Whether you’re investing in stocks, property, a business project, or a marketing campaign, ROI helps you compare how efficiently different investments use your capital. It’s widely used by companies to evaluate new projects, advertising performance, or expansion opportunities, and by individuals to assess savings, portfolios, or real estate ventures.
A clear ROI provides insight into the effectiveness of a decision and guides future strategies, whether the goal is increasing profit, cutting costs, or improving financial performance.
All investments, including stocks, bonds, real estate, and small businesses, come with the goal of making more money than you put in. The money you earn over and above your initial investment is called profit. As you’ll learn later, profit and ROI aren’t the same thing. When discussing investment profitability, however, people often use ROI. This metric expresses the amount of net profit one earned as a percentage of what the initial investment was.
ROI can help you assess if buying property or investing in a business is worth it. It also helps companies determine the value of adding new products, building more facilities, acquiring other businesses, advertising campaigns, etc.
In other terms, it's a way to compare different investments in order to figure out which ones are worth pursuing. For example, you could calculate ROI to decide whether selling one stock and buying another would be a good idea.
While there is no limit to a return on investment theoretically, in practice, no investment is guaranteed to have any return. If your ROI is negative, it means you not only failed to make a profit but also lost some of your original investment. The worst possible outcome would be -100% ROI, meaning you completely lost your initial investment. An ROI of 0% signifies that you at least recovered the money you put in, but gained nothing beyond that.
While ROI is often used as a marker of profitability, it isn't foolproof. There are several limitations to calculating ROI as your only measure which include the time frame in which you will earn back your investment, inflation rates, how risky a venture is, and additional maintenance costs that may be incurred.
ROI Terminology
Before we dive in, let's first cover some basic terminology.
Net profit or net income
Net profit is the amount of money left over after all operating costs, such as the cost of transaction costs or maintenance costs, and other expenses have been accounted for and subtracted from the total revenue. It is used to measure profitability. Net profit can also be called net income, net earnings, or the bottom line.
Total cost of investment
This figure will look at the amount of money invested in a particular investment.
How to Calculate ROI: The ROI Formula
The ROI formula is a simple equation that looks at the price change of the asset and the net profits (the initial cost of the investment minus its value when you sell it). When calculating ROI you would use this formula:
ROI = (Net Profit / Total Cost of Investment) x 100
To factor trading costs into your ROI figure, you'll use:
ROI = ((Value of Investment - Cost of Investment – Associated Costs) / Cost of Investment) x 100
As an example, let's say you buy 5 shares of $100 each in Tesla, equating to $500. You sell them a year later for $150 each, equating to $750. Let's say you paid $5 commission on each trade, costing you $25 in trading fees.
ROI = (($750 - $500 - $25) / $500) x 100 = 45%
This means that you made a 45% return on investment on that particular investment.
What is a Strong ROI
A "good" return on investment is any number above 0, as this means you made some profit. However, the ideal ROI should be higher than what you could've earned had you chosen another investment (the next best thing).
To compare this, investors often compare their earnings to what they could've made on the broader stock market or in a high-yield savings account. Using the S&P 500 as a control, over the past four decades it has made gains of around 7% (after inflation). An ROI is generally considered to be a strong one if it beats the stock market in the long term.
However, risk and return are directly linked. High ROIs often come with higher volatility or uncertainty. Property, stocks, and startups may yield better returns but can also result in losses. Safer investments, like savings accounts or government bonds, tend to offer lower but more predictable ROIs. Moreover, it's always important to note that past performance does not equate to future results.
Therefore, a strong ROI will vary depending on the investment's level of risk, your goals, and how much risk you're willing to take.
ROI vs Profits
ROI and profit are related but not identical. Profit is the absolute amount of money gained after costs, while ROI expresses that profit as a percentage of the original investment.
For instance, a $1,000 profit might sound good, but if it came from a $100,000 investment, the ROI is just 1%. That’s why ROI is a more useful metric for comparing opportunities or assessing performance across projects.
Use ROI for decision-making and benchmarking; use profit for understanding absolute earnings.
Benefits of Using ROI
Return on investment (ROI) is widely valued for its clarity and practicality. It allows both individuals and businesses to assess whether their financial choices are creating real value, providing a clear, quantitative foundation for better decision-making. It remains one of the simplest and most effective tools for:
- Comparing investments as it standardises performance across asset types.
- Guiding decisions, where it is used to prioritise projects or marketing strategies.
- Measuring performance by tracking financial efficiency over time.
- Allocating resources by showing where capital yields the best results.
Its simplicity and flexibility make it an essential concept in finance, marketing, and project management alike.
Where the ROI Formula Falls Short
The main limitation of using this return on investment ROI formula as a marker of success is that it doesn't show how long it took to earn the money back. When comparing various investments, the time it takes to mature will have a significant impact on the profits you could earn.
For instance, a year loan versus a bond held for five years versus a property held for 10 years will all have varying ROIs once you've established how long it will take to earn the specified ROIs.
In this scenario, the ROI calculations mentioned above skimp on the full story. It also doesn't account for risk. For instance, the loan repayments could be delayed or the property market might be in a slump, all affecting the potential profits earnable.
With many variables, it becomes harder to predict what the exact ROI calculation on an investment will be, so be sure to factor this in when using the return on investment ROI formula to determine how attractive an investment opportunity or business venture is.
ROI Alternatives
Although the return on investment doesn't consider how long you keep an asset, it's essential to compare the ROI of investments held for comparable lengths of time as a more clear performance measure. If that's not possible, there are a few other options.
Average Annual Return
Also known as annualized return on investment, this adjusts the ROI formula to factor in the timing. Here you would divide the ROI by the number of years you hold the asset.
Compound Annual Growth Rate (CAGR)
This option is more complicated but yields more accurate results as it factors in compound interest generated over time.
Internal Rate of Return (IRR)
This measure factors in the notion that profits earned earlier outway the same profits earned later, taking into account interest that could've been earned and factors like inflation. This equation is quite complicated but there are online calculators one can use.
Conclusion
A return on investment (ROI) is a formula used to calculate the net profit or loss of an investment in percentage form. The ROI calculation can present valuable information when investing capital or determining profitability ratios. The ROI equation looks at the initial value of one investment and determines the financial return. A negative ROI indicates that the investment returns were lower than the investment cost.
Since the advent of cryptocurrencies in 2009, the world has seen a substantial shift in the way that people transact and manage their money online. The first cryptocurrency, Bitcoin, sparked a wave that has impacted almost every corner of the globe, significantly shifting the financial landscape as we know it. Let’s explore how crypto is expanding economic freedom on a global scale.
What is economic freedom?
Before we evaluate how this $2 trillion industry is contributing to financial liberation, let’s first establish what economic freedom is. Explained simply, the term refers to measures that grant users the freedom to manage their money, property, and labour in each country, which is then compared globally.
More accurately, the measure of economic freedom is determined by using the Index of Economic Freedom, which weighs up 12 factors contributing to a country’s overall measure. This is broken down into 4 categories, each carrying varying subcategories, such as market openness measuring a country’s trade, financial and investment freedom. The others are regulatory efficiency, rules of law, and government size, each with its own subcategories.
This index was first published in 1995 by The Heritage Foundation and The Wall Street Journal and is used around the world today. This year, Singapore, New Zealand, Australia, Switzerland, and Ireland have ranked as the most financially free countries in the world.
Crypto and economic freedom
Cryptocurrencies were first established to provide an alternative monetary solution to the global financial crisis that sent the world into disarray in 2007. Satoshi Nakamoto created the new age payment system to empower individuals to hold control over their own finances, allowing them to manage and transact their money without the control of an authoritarian entity. For the first time in history, people were able to send money overseas without incurring the usual costly and time-consuming setbacks incurred with regular, global fiat transactions.
Due to the decentralized nature in which they are run, people are responsible for managing their own crypto wallets and specialised users on the network positioned across the globe are responsible for verifying and executing transactions. After Bitcoin entered the scene a significant number of new cryptocurrencies have been launched, over 12,000 at the time of writing. While some maintain the same “medium of exchange” model, many new cryptocurrencies have emerged providing alternative solutions to the industry.
Ethereum, the world’s second-biggest cryptocurrency, for example, provides a platform on which developers can create their own decentralized apps and cryptocurrencies, while other cryptocurrencies revolve around faster transaction times, cloud storage and private transactions. Each of these projects utilizes a blockchain network that was designed to improve and innovate the crypto and blockchain space.
Spanning beyond government control and lengthy paperwork, cryptocurrencies are able to provide a global currency that operates entirely online and is not confirmed to the borders of a country. Cryptocurrencies are global, accessible 24/7 and cannot be frozen in accounts.
How crypto is driving economic freedom
Requiring only an internet connection and start-up funds, Bitcoin (and cryptocurrencies in general) allows anyone around the world to create a wallet and start trading. One doesn’t need access to a large bank branch or lengthy paperwork, one simply needs an internet connection and a smartphone.
Curling back to the factors that contribute to economic freedom, cryptocurrencies are able to seamlessly check six of twelve of the categories of the Index of Economic Freedom through their innate properties.
- Trade Freedom [Market Openness]
- Financial Freedom [Market Openness]
- Business Freedom [Regulatory Efficiency]
- Labour Freedom [Regulatory Efficiency]
- Monetary Freedom [Regulatory Efficiency]
- Property Rights [Rule Of Law]
The remaining categories however revolve around the governments running the nations in question, particularly the rule of law and government size categories. Nevertheless, cryptocurrencies can still assist in creating better-functioning economies and provide the technology that allows for a more open and free financial system.
A free and open financial system
As cryptocurrencies remove the barriers of borders, they allow people to transact their money in the same way that they communicate with each other (through the internet). As the digital age continues to evolve, we are likely to continue seeing a significant increase in the level of economic freedom that crypto provides to users around the world, empowering both the individual and the nation.
Bitcoin and other cryptocurrencies are all about decentralised, worldwide, financial independence and liberty. Cryptocurrencies are borderless, censorship-resistant digital currencies that can be used by anybody with internet access.
As a result, crypto, at least in principle, appears to be the perfect solution for international travellers or "digital nomads." With the added advantage of having the Tap app, users can instantly and seamlessly use their cryptocurrencies as they would regular fiat currencies when travelling around.
With the growth rate of blockchain technology and crypto adoption increasing, it's only natural that we're seeing more options to spend and travel the world using cryptocurrency.
In this article, we'll look at a variety of different ways to spend your crypto while travelling with Tap and how to spend seamlessly with your Tap card. We will explore why people choose to use their crypto to travel and how the exploding $1 trillion travel market is important for the cryptocurrency industry.
Entirely Cashless
The beauty of travelling with crypto is that it is entirely cashless. You won't have to worry about dealing with foreign currency exchanges when entering or leaving a different country as all of your money is kept digitally online in your app.
With the Tap card, users can use their crypto balances to load their card and freely swipe away worldwide. The card allows for seamless payments at millions of merchants around the world, with the merchant none the wiser.
The option to upgrade to more premium accounts allows you to reduce or completely eliminate any FX fees. Get empowered and enjoy the best out of your money wherever you go.
Reduces Risk
Instead of being a target for muggings looking to steal cash, being entirely digital bypasses this risk.
Accessible
Should something happen at home you can easily and quickly send funds back. Operating 24/7 and only requiring an internet connection, sending money back home can be completed at a moment's notice. Send funds to your friends and family via crypto or fiat for free on their Tap account.
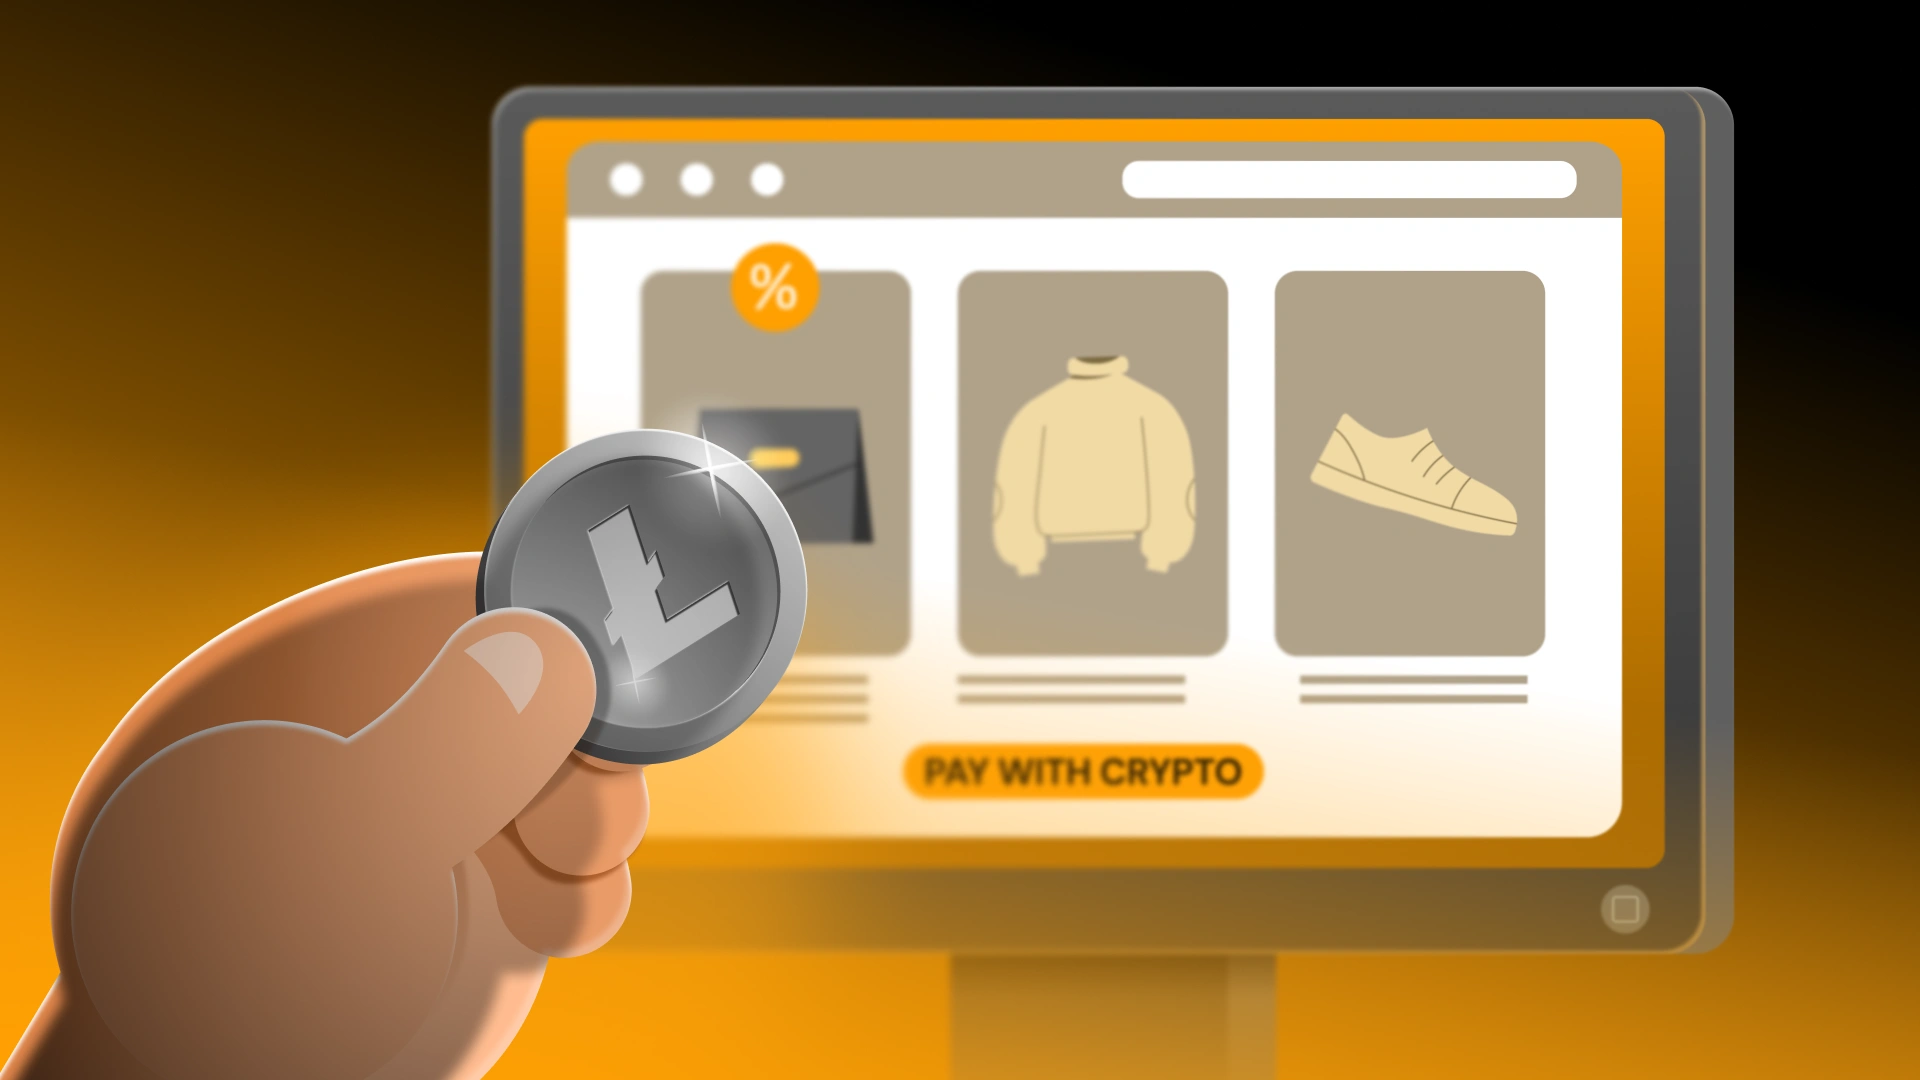
Discounts
Last but not least, many companies offer discounts to users paying with cryptocurrencies. From travel to retail, and everything in between, users can enjoy added discounts just by utilising crypto.
Should an event arise that you do need cash, users can easily withdraw cash from a regular ATM using their Tap card. Paying significantly lower fees than you would with your standard bank card, the Tap card allows you to seamlessly integrate into the foreign country with peace of mind.
How To Travel Abroad With Tap
This is the ultimate crypto vacation guide showing you how to buy everything that you might need through the Tap app for that epic crypto vacation abroad.
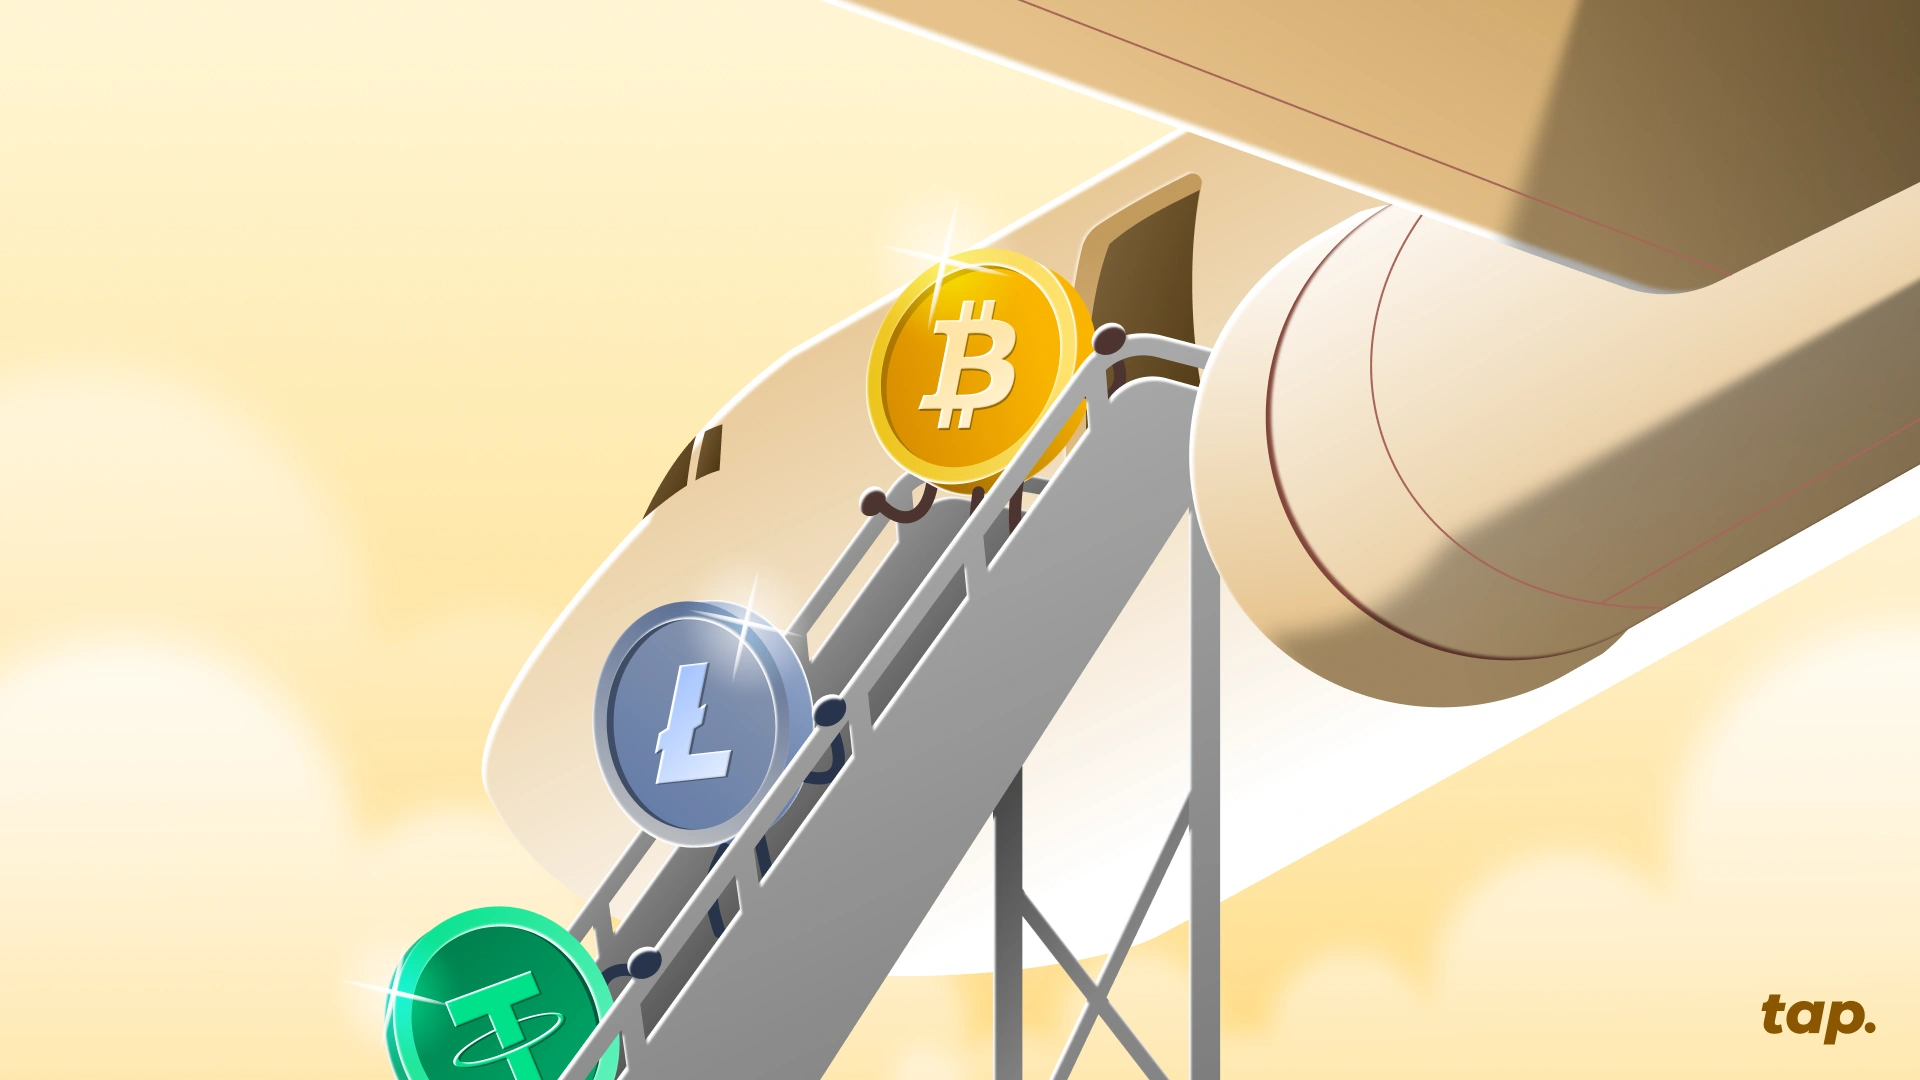
Flights
CheapAir.com was the first US online travel agency to open its doors to crypto, getting into the game as early as 2013. The company currently allows holidaymakers to make payments using Bitcoin, Litecoin, Bitcoin Cash and Dash.
In 2020, Travala and Expedia merged to give users access to millions of hotels and villas worldwide payable in over 30 popular types of cryptocurrencies. There is also Destinia.com in Spain, airBaltic in Latvia, Surf Air in the US, and Peach Aviation in Japan.
Conveniently buy everything you need with your Tap app by scanning the company’s QR code and confirming the transaction. Alternatively, you can make online purchases using your Tap card.
Accommodation
Travala, CheapAir.com and Destinia all allow users to book flights and accommodation in one smooth transaction. On Destinia look out for the GoCoin merchant plugin.
Booking.com has partnered with flight planner, A Bit Sky, to provide a location with both flight and accommodation options.
Savvy accommodation-seekers can look to Airbnb-style crypto startups like 99Flats in India or CryptoCribs on Reddit, or head over to XcelTrip,a decentralized travel ecosystem, which provides access to 400 airlines and 1.5 million hotels.
Food and Drink
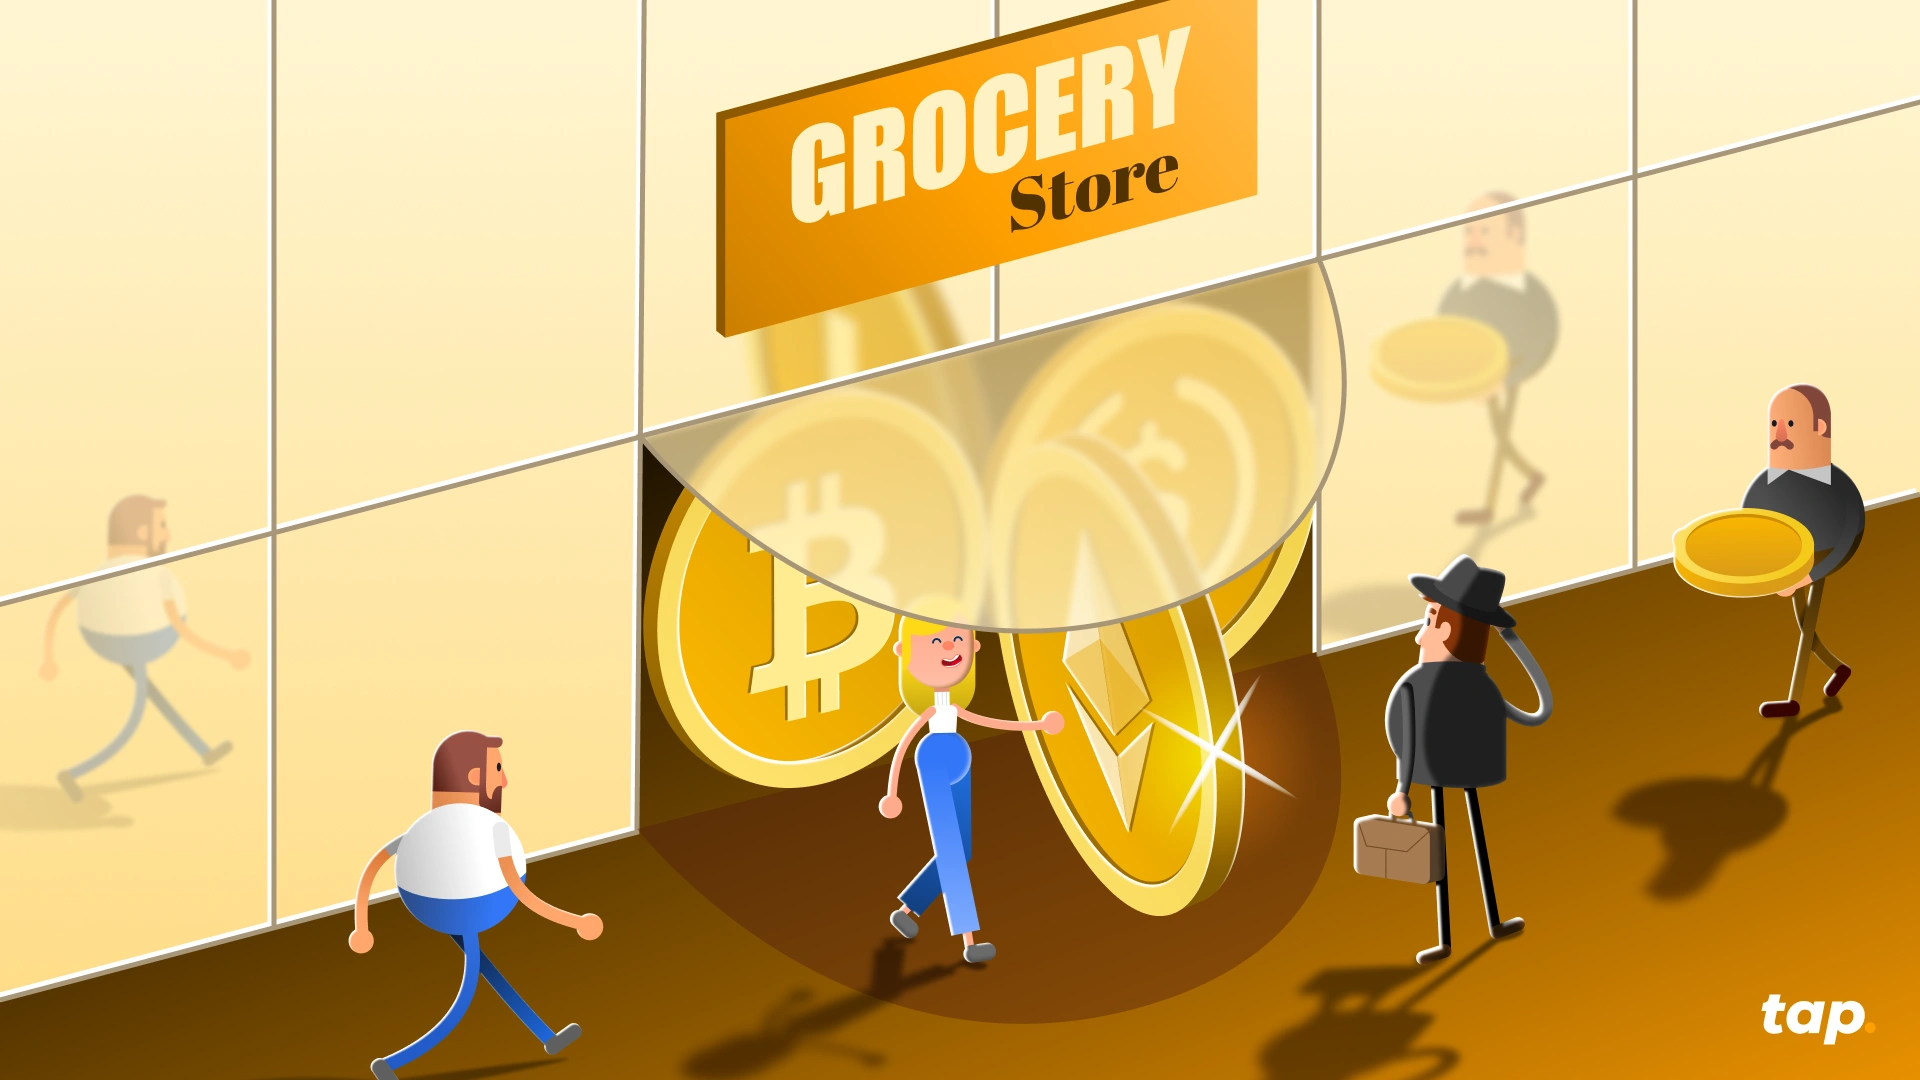
CoinMap is an app for anyone and everyone wanting to find crypto-friendly companies. Felix Weis, as well as numerous other cryptocurrency influencers, has credited CoinMap with being the saviour for finding the closest cafe, bar, or restaurant that accepts Bitcoin, including international chains such as Subway and local providers who use crypto merchants. Say goodbye to walking around with boatloads of cash and just take your Tap app along instead.
Holidaymakers can also look to using crypto to buy a gift card which can be purchased online through Gyft or eGifter, with eGifter offering a 5% discount for purchases made with Bitcoin. eGifter offers gift cards to restaurants like Papa John, Taco Bell, Dunkin’ Donuts, TGI Fridays, UberEats and more.
Getting Around
Expedia, A Bit Sky, Destinia, and CheapAir all offer access to transfers or car rentals in their services, while Gyft and eGifter offer Uber vouchers. There is also SpendBitcoin.com, which locates different crypto-accepting services in an area, simply chose the car filter option.
Things To Do
Again, Gyft and eGifter provide access to options like Groupon where you can find local activities on offer, or head to purse.io for any last-minute Amazon purchases (snorkel, anyone?).
Travel The Tap Way
Both the Tap card and the Tap app can provide a seamless and cost-effective solution to using both fiat and cryptocurrencies when travelling. Simply load your wallet with crypto and fiat currencies, and pay directly from the app or use the card to pay at millions of merchants around the world. Say hello to easy travel and plenty of discounts.
With a range of coins on offer and an integrated smart engine that ensures the best possible prices in real time, travelling with cryptocurrencies and Tap is as smooth a ride as it gets.
With a range of coins on offer and an integrated smart router, Tap lets you store and manage your digital assets wherever, whenever. There are no border delays or inconvenient payment processes to worry about while travelling with crypto only speed and convenience. Tap is as seamless a journey as it gets.
If you’re a business owner looking to tap into the over 575 million people across the globe using cryptocurrencies, you’ve come to the right place. In this piece, we’re covering why that’s a great idea, and how you can incorporate cryptocurrencies as a payment option.
The benefits of crypto payments
Whether you want to accept Bitcoin payments or crypto payments, incorporating digital currencies into your business is a great idea. Below we run through several advantages that crypto payments bring to the table.
- Faster Settlements
Did you know that credit card companies can take a few business days to move the funds into your account? With crypto payments, once the transaction has been executed the funds will (almost) immediately appear in your crypto wallet.
- Lower Fees
Card processing companies charge anywhere from 1% - 3% plus an additional charge for using that service. Other payment services, like PayPal for example, charge even more. While the transaction fee structure is dependent on the specific network, cryptocurrencies charge a minimal flat rate, with no added hidden costs. When making or accepting crypto payments, you will know the transaction fees upfront.
- Wider Audience
According to Statista, there are over 575 million people using cryptocurrencies, offering a much wider audience for your business to tap into. Capture new customers by adding crypto payments to your payment options and attract a new demographic.
- Reduce Fraudulent Charges
Fraudulent card activity costs the global economy over $32 billion each year. These chargebacks can occur for a number of reasons, from technical issues to outright fraud. With cryptocurrencies, transactions are final and cannot be reversed due to the nature of blockchain technology facilitating these crypto payments.
How crypto payments can take your business to the next level
Accepting cryptocurrency payments allows your business to tap into a new growth potential, opening your business up to over 575 million global crypto users, attracting a forward-thinking new customer base seeking cutting-edge payment options.
Additionally, you will be able to enjoy the benefits of near-instant settlements directly into your crypto wallet and ultra-low transaction fees that let you save big. Say goodbye to frustrating chargebacks and fraudulent transactions thanks to crypto's secure technology. Let crypto payments propel your enterprise to new heights.
https://www.youtube.com/watch?v=ILSss0jpENQ
What does a business accepting cryptocurrencies entail?
First, you will need to have a proper understanding of cryptocurrencies and an idea of which cryptocurrencies you would like to accept. While most businesses new to accepting crypto payments might opt for Bitcoin payments, there are several alternative options with varying features. Bitcoin Cash, for example, provides faster transaction times at a lower cost.
Next, you will need to create an account with a payment gateway, the crypto equivalent of a payment processor. This gateway will allow you to transfer crypto to fiat and vice versa easily. Ensure that the platform you opt to use is reputable, has high levels of security, and is in line with the regulatory requirements. If you decide to accept Bitcoin payments, you need to ensure that everything you are doing is above board.
Once you have chosen your payment gateway and set up the account, the last step is to let your customers know. Whether you do this through a marketing campaign or simply incorporate the crypto QR code on your website or in-store, this is an excellent opportunity to get the word out there and create a buzz around your business now accepting crypto payments.
A crash course in cryptocurrencies
For the sake of getting you fully prepared to accept crypto payments, we've included a short crash course on cryptocurrencies. The first cryptocurrency to come into existence was launched in 2009 as a response to the global financial crisis. The still-anonymous creator, Satoshi Nakamoto, wanted to create a global digital currency that would allow each individual to take control of their own funds, and not have to rely on governments and centralised financial institutions to do so.
A few years after Bitcoin entered the scene, several other cryptocurrencies started emerging, many of which used the same infrastructure. Bitcoin Cash and Litecoin are examples of this, offering the same service with several tweaks, notably faster and cheaper transactions.
While adoption was slow to take off, crypto payments eventually integrated into the mainstream financial sector as several companies started catering to the crypto crowd. While the markets still go through the typical economic cycles, cryptocurrencies and most notably crypto payments are here to stay.
How can I incorporate cryptocurrency payments into my business?
If you’ve decided to accept Bitcoin payments and propel your business into the crypto-sphere, the process is likely to be much more simple than one would initially imagine. Accepting cryptocurrency payments is made even easier through Tap’s corporate crypto accounts, created especially to fulfil your business needs.
The best part about deciding to accept cryptocurrency payments is that you don't need to forgo your traditional payment methods. Cryptocurrency works perfectly alongside your current point-of-sale system and offers an alternative online payment solution. With Tap, you also don't need to worry about crypto price volatility as you can easily make the quick exchange of crypto to fiat directly through the app.
In order to start accepting Bitcoin payments, you will need to fill in a quick form on the Tap website. You do not need to have a Tap account prior to this. One of our Account Managers will make contact with you and assist with the setup process, including creating a crypto wallet for your business. This Account Manager will continue to work closely with you, providing assistance at any time.
Tap is fully regulated by the Gibraltar Financial Services Commission and operates with a stringent level of security. Known for its easy-to-use crypto payments app, Tap allows users to buy and sell a range of crypto assets and easily convert them to fiat. Integrating the traditional financial sector with the crypto sector, Tap allows users to make payments directly from the app, selecting which currency, whether fiat or crypto, they would like to use.
The app also provides users with the opportunity to earn interest on their crypto and fiat currencies by simply depositing them into a specific fiat or crypto wallet. With no lock-in periods and constant access to the funds, users can earn interest which is paid out weekly. Corporate crypto accounts offer the same earning opportunities.
To find out more about our crypto accounts for businesses and set up your account to accept cryptocurrency payments, take a look here.

Whether you're trying to navigate the world of Crypto Twitter or preparing for Web 3.0, understanding the lingo is imperative to understanding the information available and fitting in. You might be very familiar with the English language, but don't let that fool you, crypto slang on social media is a language of its own.
While you might be familiar with concepts such as mining and smart contract, here we upgrade you to the next level of crypto jargon content. Below we run you through the 20 biggest acronyms and terms you need to learn when embarking on your Crypto Twitter journey. Good luck!
20 Top crypto terms and acronyms
Apeing In
Apeing in refers to buying a token or more commonly an NFT right after launch without doing the necessary research. Also sometimes expressed as "I aped", this is usually a result of being fearful you're going to miss out on potential gains. Always DYOR.
Bag Holder
This term refers to an investor that is holding a cryptocurrency or NFT that they cannot sell for a higher price, and cannot sell at the current price (as it is too low). While this isn't entirely negative, it's not very positive either. Bag holders will simply need to wait out the market dip.
BUIDL
First made famous by Ethereum founder, Vitalik Buterin in 2018, buidl is an obvious typo of the word build and refers to "build useful stuff". The concept revolves around developers utilizing blockchain technology, to hopefully, provide a solution to the industry as a whole.
BTFD
Standing for Buy The F** Dip, BTFD has been described as a "prominent investment lesson". Buying the dip is when investors accumulate cryptocurrency during a bear market when the prices are trading at less than their value. Quoting Warren Buffet, "be fearful when others are greedy, and greedy when others are fearful."
DAO
DAO stands for decentralized autonomous organization and acts as a form of venture capital funding, replacing a board of directors with open-source coding. Operating entirely automatically, everyone is granted ownership and is involved in the decision-making. DAO essentially describes the structure of Web 3.0 companies.
dApps
You may be familiar with this term already, decentralized applications are any digital apps built on top of a blockchain network. Instead of operating off of a centralized computer system, dapps harness the power of blockchain and are maintained and operated by the network on which they're built.
Ethereum, Solana and Cardano are popular platforms on which developers built their dapps, with no limit to what industry these dapps can be built for, from payments to entertainment to supply chain management.
Diamond Hands
This term refers to an investor who will never sell. Diamond hands push through the losses, gains and volatility, resisting the dips and the peaks. These are hardcore hodlers who strongly believe in a project's vision.
DeFi
Another term you're likely to have come across is decentralized finance, DeFi. DeFi is a sector of the crypto industry that provides traditional financial products and services only using blockchain technology, like lending, borrowing and providing liquidity. The aim of DeFi products is to remove the centralized nature of banking and make things more accessible to the masses. PancakeSwap, Aave and The Graph are examples of DeFi platforms.
Degen
Degen is short for degenerate risk-taker, someone who makes highly risky bets without due diligence. While this is typically frowned upon in the real world, in the crypto world this is a badge of honour. Being a degen and making money fast is the ultimate flex. We still recommend that you DYOR beyond just the project's website.
DYOR
Possibly the most important phrase when it comes to investing in cryptocurrencies and NFTs: always do your own research. Never follow anyone's advice blindly, no matter how much money they've made, instead always look into a project before investing in it. DYOR takes a firm stand in reminding you that you are accountable and responsible for your investment choices.
GMI
A term of endearment in the crypto space, GMI stands for Gonna Make It, used to reassure someone that they're on the right track. Often thrown around on Twitter and Discord, GMI offers someone an affirmation in their decisions.
On that note, NGMI stands for Not Gonna Make It. Usually used when someone makes a mistake or does something crazy, or when someone makes ignorant comments about the crypto space when they know little about it. It can be brutal out there, but DYOR and you'll be ok.
Genesis Collection
Similar to how the first block on a blockchain is referred to as the genesis block, a genesis collection is the first NFT collection created by an artist. Buying items from a genesis collection is a symbol of early support and usually comes with some added benefits. Following the transaction for the digital currency, holders might be treated to early releases, insider info or concert tickets.
HODL
While we're familiar with what HODL refers to (holding onto a cryptocurrency for a long time in order to tap into possible future gains), many might not be aware that it has been gifted an acronym of its own. We say gifted because the term originated from a typo in a Bitcoin forum. HODL has affectionately been expanded to Hold On for Dear Life, encouragement for when markets dip and weak hands consider selling.
Metaverse
A hot topic at the moment, but do you know what it means? The metaverse refers to an alternative reality that exists in the digital realm. This digital space allows users to work, play, socialize and do business, interacting with others as they do. The metaverse can be described as a combination of VR (virtual reality), AR (augmented reality) and 3D worlds.
NFT
This is a big one. It stands for Non-Fungible Tokens and refers to anything that someone can create store and sell on the blockchain but is not fungible. Each NFT is unique and cannot be used interchangeably like most other cryptocurrencies. Also note that an NFT is a token standard and can be built on various blockchains, while ETH for instance is the native token to Ethereum and cannot be used by other blockchains.
Shill
Shill refers to someone promoting a particular cryptocurrency to create excitement for it, usually to their own financial benefit. The purpose of shilling a coin is to generate hype that will hopefully lead to mass buying. Most platforms frown against shilling as it's essentially part of the same family tree as pump and dumps.
Paper Hands
The opposite of diamond hands, paper hands are quick to sell, often too early. Giving in to pressure and volatility, paper hands sell when the financial risk is too high (as opposed to waiting out the dip).
P2E
P2E stands for play to earn and is a concept in gaming where players can earn an in-game asset that holds value outside of that ecosystem. Axie Infinity, for example, is a game in which users can earn AXS, which is traded on many big exchanges. Gods Unchained and Evaverse are other P2E games.
RUG
Sometimes referred to as a "rug pull", rug is used to describe a situation where the founders of a project run away with the raised funds. These scams are not uncommon in the unregulated world of cryptocurrencies, however, they have become much fewer and far between since the earlier days. Their actions often send the crypto price plummeting to zero and cause huge losses among investors.


