
Learning the friendly way
Dive into our resources, guides, and articles for all things money-related. Grow your financial confidence with our experts curated tips and articles for both experienced and new investors.
LATEST ARTICLEs

La rareté est un concept central qui met en lumière l'écart entre nos besoins illimités et les ressources limitées disponibles dans le monde. Cette notion ne se limite pas aux biens et services quotidiens ; elle est également cruciale dans l'univers de l'investissement. Comprendre la rareté permet d'expliquer comment nous prenons des décisions concernant l'utilisation des ressources, comment les marchés fonctionnent et comment les prix se forment. Que vous vous intéressiez aux défis des ressources mondiales ou aux opportunités d'investissement, saisir l'impact de la rareté est essentiel pour naviguer dans ces domaines complexes.
Définition de la rareté
En termes économiques, la rareté signifie qu'il existe une offre limitée de matières premières, de terres, de main-d'œuvre et de capital disponibles, tandis que les demandes et les désirs des individus, des entreprises et de la société dans son ensemble sont pratiquement illimités.
Du point de vue de l'investissement, la rareté se manifeste par le nombre limité d'actions de haute qualité disponibles sur le marché. Alors que le nombre d'investisseurs à la recherche d'opportunités rentables ne cesse de croître, il n'existe qu'un nombre restreint d'entreprises performantes dans lesquelles investir.
Cette rareté entraîne souvent une hausse des prix des actions les plus performantes, car davantage d'investisseurs sont en concurrence pour acquérir des parts de ces entreprises attrayantes mais limitées. Par conséquent, les investisseurs doivent soigneusement hiérarchiser leurs choix d'investissement, en équilibrant les rendements potentiels avec les coûts plus élevés des actifs rares et très demandés.
Les facteurs influençant la rareté
Les économistes utilisent le terme de rareté pour expliquer pourquoi certains biens ou ressources autrefois abondants deviennent limités au fil du temps. On peut classer les principales causes de rareté en trois catégories :
La rareté induite par la demande :
Ce phénomène se produit lorsque la demande pour un bien ou un service dépasse l'offre disponible. Par exemple, lors du lancement d'une nouvelle console de jeu populaire, elle peut rapidement être en rupture de stock car la demande surpasse l'offre initiale.
La rareté induite par l'offre :
Elle survient lorsque des facteurs externes rendent la production ou l'obtention d'une ressource plus difficile, réduisant sa disponibilité sans nécessairement modifier la demande. Un exemple serait une pénurie de semi-conducteurs due à des perturbations dans la fabrication, affectant la production d'appareils électroniques.
La rareté structurelle ou relative :
Ce type de rareté apparaît lorsque certains groupes ont un meilleur accès à une ressource que d'autres. Souvent, cette inégalité découle de facteurs politiques ou économiques plutôt que de la quantité réelle de la ressource disponible.
La rareté dans différents secteurs
La rareté affecte différemment les diverses industries. Dans l'agriculture, des phénomènes tels que les sécheresses ou les mauvaises récoltes peuvent réduire les approvisionnements alimentaires, entraînant une hausse des prix et modifiant les habitudes de consommation. Dans le secteur technologique, les pénuries de composants comme les semi-conducteurs peuvent ralentir la production, augmenter le coût des appareils et limiter l'offre aux consommateurs.
Dans le domaine de la santé, le manque de médicaments essentiels ou d'équipements peut entraîner une hausse des coûts et restreindre l'accès aux soins. Ces raretés influencent les volumes de production, les prix de vente et les choix des consommateurs quant à ce qu'ils peuvent se permettre ou obtenir.
En finance, la rareté joue également un role crucial. Les ressources en capital limitées obligent les investisseurs à choisir soigneusement où allouer leurs fonds, tandis que la rareté des opportunités d'investissement peut faire monter les prix des actifs dans les secteurs économiques en vogue.
L'impact de la rareté sur la société
Dans notre société moderne, la rareté touche l'ensemble des acteurs économiques : les individus, les entreprises et les gouvernements. Pour les particuliers, cela implique de faire des choix difficiles sur la manière de dépenser leurs ressources et de définir leurs priorités.
Les entreprises, quant à elles, font face à des défis pour s'approvisionner en matériaux ou gérer leur production, ce qui peut affecter leurs prix et leurs opérations. Les gouvernements doivent naviguer avec la rareté lorsqu'ils élaborent des politiques, équilibrent les budgets et répondent aux besoins publics.
La rareté influence les politiques économiques en orientant les décisions sur l'allocation des ressources, les investissements et la réglementation. Elle façonne également la dynamique des marchés en économie, car les fluctuations de l'offre et de la demande affectent les prix et la disponibilité des biens et services, impactant l'économie dans son ensemble.
La rareté dans le contexte économique
Du point de vue de l'investissement, la rareté fait référence à la disponibilité limitée d'un actif par rapport à une forte demande, ce qui peut augmenter sa valeur. Elle se produit lorsque les ressources ou les actifs sont en quantité insuffisante par rapport au nombre d'acheteurs intéressés. Les facteurs causant la rareté incluent les limites des ressources finies, l'augmentation de la demande ou les perturbations dans les chaînes d'approvisionnement.
Pour les investisseurs, la rareté peut rendre certains actifs plus attrayants, car leur nature limitée peut conduire à des prix plus élevés et des rendements potentiels supérieurs. Prenons l'exemple du Bitcoin : avec une offre maximale plafonnée à 21 millions d'unités, on peut s'attendre à ce que sa rareté croissante exerce une pression à la hausse sur son prix.
Stratégies pour faire face à la rareté sur les marchés
Que vous soyez investisseur ou trader, voici six stratégies qui peuvent vous aider à naviguer sur les marchés avec discernement :
Diversifiez vos investissements : Répartissez vos investissements dans différents domaines pour atténuer l'impact si un secteur rencontre des difficultés.
Privilégiez les secteurs stables : Optez pour des domaines ou des actifs moins susceptibles de faire face à des problèmes d'approvisionnement, comme ceux disposant de ressources abondantes.
Explorez de nouveaux marchés et technologies : Intéressez-vous aux marchés émergents ou aux technologies innovantes qui pourraient offrir des opportunités de croissance.
Concentrez-vous sur la valeur à long terme : Considérez des actifs comme l'immobilier ou les matières premières qui sont susceptibles de conserver leur valeur dans le temps.
Restez informé : Suivez attentivement les tendances du marché et les changements dans l'offre et la demande pour vous adapter aux conditions de rareté.
Adoptez une approche durable : Investissez dans des projets ou des technologies qui utilisent les ressources de manière efficace et pourraient contribuer à relever les défis futurs liés à la rareté.
Il est important de noter que ces suggestions sont à considérer dans le cadre d'une réflexion globale et ne constituent pas des conseils financiers. Il est recommandé d'effectuer des recherches approfondies avant de mettre en œuvre l'une de ces stratégies.
Conclusion
La rareté est un concept clé en économie qui illustre le fossé entre nos désirs illimités et les ressources limitées disponibles. Elle affecte tous les aspects de notre société, des choix quotidiens des individus à la planification stratégique des entreprises et des gouvernements.
Comprendre la rareté permet de prendre des décisions d'investissement plus éclairées, de gérer les ressources de manière plus efficiente et d'élaborer des politiques plus efficaces. Cette compréhension est essentielle pour naviguer sur les marchés financiers, équilibrer les besoins sociétaux et assurer une utilisation judicieuse des ressources à notre disposition.

Fini les galères de solde au moment de payer. Activez une fois l’Auto Recharge, et votre carte Tap se recharge toute seule quand le solde est bas — avec vos euros ou même vos cryptos. Tranquille.
Vous nous l’avez demandée, on l’a fait. Cette nouvelle option est là pour vous simplifier la vie. Votre carte reste toujours prête, et vous pouvez penser à autre chose (comme à ce que vous allez commander ce midi 🍟).
Cerise sur le gâteau 🍒 : vous pouvez recharger avec vos cryptos.
Choisissez une de vos cryptos, rechargez, dépensez — aussi simple que ça.
Pourquoi vous allez l'adorer
Plus jamais de “solde insuffisant” 🙃
Votre carte se recharge toute seule, pile au bon moment.
Vous l’activez une fois, et c’est tout.
Plus besoin d’y penser, Tap s’occupe du reste.
Fiat, crypto, ou les deux.
C’est vous qui choisissez.
Toujours prêt à payer.
En ligne, en voyage, pour les courses— votre carte suit le rythme.
Comment ça marche ? ✨
C’est vous qui décidez :
- Du montant minimum avant déclenchement
- De combien recharger
- De la devise à utiliser
Comment l’activer ?
- Ouvrez l’app Tap
- Allez dans la section Carte
- Activez l’Auto Recharge
- Réglez vos préférences
Toujours là quand vous en avez besoin
L'auto recharge, c’est un coup de pouce pour votre quotidien. Moins de gestion, plus de tranquillité. Votre carte Tap s’adapte à votre rythme.
Besoin d’aide ? Notre équipe support est dispo pour vous aider à tout configurer.

Cryptocurrencies derive their value from supply and demand, with the buyers and sellers playing an enormous role in the market's liquidity, and ultimately, success. This rings true for stocks, commodities and forex markets too, essentially any asset markets with trading volumes.
Anyone participating in these markets will have been a maker or a taker at some stage, most likely, both. In this article, we're breaking down the concept of makers vs takers, exploring their vital role in the market and large quantities of these result in stronger exchanges.
Liquidity Explained
Before we dive in, let's first cover an important concept: liquidity. Assets can sometimes be described as liquid or illiquid, this simply refers to how easily the asset can sell. Gold is a prime example of a liquid asset as anyone could easily trade it for cash without any hassle, while a glass statue of your neighbour's cat would be an illiquid asset as the chances of anyone wanting to own it are slim (except for the neighbour, maybe).
Building on this, market liquidity indicates how liquid a market is. A liquid market means that the asset is in high demand, traders are actively looking to acquire the asset, while also having a high supply, meaning that traders are actively looking to offload the asset. An illiquid market then means that there is low supply and demand, making it difficult to buy or sell the asset for a fair price.
In a liquid market where there are many traders looking to buy and sell an asset, the sell order (ask price) tends to be in the same region as the buy order (buy price). Typically, the lowest sell order will be the same as the highest buy order, creating a tight buy-ask spread.
Now that we've covered liquidity, it's time for makers vs takers.
What Is The Difference Between Market Makers And Market Takers?
As mentioned above, any successful exchange requires a fair amount of makers and takers. Let's explore the difference between the two below.
Market Makers
Exchanges typically use an order book to conduct trades. The order book will store offers to buy and sell as they come in, and execute the trades when the criteria are met, i.e. someone could create an offer that says when Bitcoin reaches $40,000, buy 4. When the BTC price reaches $40,000, the order book with automatically execute this trade.
In this case, the person creating this buy order is known as a maker. They are essentially "making" the market by announcing their intentions ahead of time via the order book. While many retail investors are makers, the field is typically made up of big traders and high-frequency trading institutions.
A market maker is a liquidity provider.
Market Takers
Market takers are then liquidity "takers", removing liquidity from the market. Takers create market orders that indicate to the exchange that the trader wants to buy or sell at the current market price. The exchange will then automatically execute the trade using a maker's offer.
A taker is a trader filling someone else's order. Market makers create offers for the order book, making it easier for users to buy and sell, while market takers exercise this liquidity by buying the asset.
What Are Maker-Taker Fees?
You might have heard of maker-taker fees before, this makes up a considerable amount of how exchanges generate an income (after all, exchanges are businesses that need to make money). When an exchange matches a maker and a taker, they will take a small fee for the efforts on their part. This fee will differ from exchange to exchange, and will also be dependent on how big of a trade it is.
As makers are providing liquidity to the exchange (an enticing attribute for any trading platform) they will pay lower fees compared to a trader taking away from the platform's liquidity. Always be sure to check the fee structure and pricing on a platform before engaging in any trading activity, these will be outlined in the platform's trading policy.
How Do Trading Companies Make Money?
Cryptocurrency and blockchain technology was designed to provide a decentralized financial system that bypasses government control. However, to alleviate regulatory concerns, exchanges were established to provide a reliable and convenient means of operating within the crypto markets. These exchanges provide a secure way in which users can buy, sell and trade cryptocurrencies, and in return make money through the activities of its customers as it is a business after all.
While maker and taker fees make up a large portion of how a platform generates an income, the business also generates income through deposit and withdrawal fees, commissions made on trades and listing fees. These typically make up the cost of production and running the business.
In Conclusion
Market makers contribute to the market's liquidity by creating orders looking to be filled, while market takers fill these orders. Makers are typically rewarded for bringing liquidity to a platform with low maker fees, while takers pay higher fees when they make use of this liquidity, easily buying and selling the asset.

Travailler et être payé en cryptos, c’est désormais possible
Se faire rémunérer en cryptomonnaie a ouvert les portes d’un marché du travail mondial sans frontières. Finis les freins géographiques ou les lourdeurs administratives : aujourd’hui, vous pouvez travailler pour une entreprise à l’autre bout du monde et recevoir votre salaire en crypto, en quelques minutes et sans frais bancaires excessifs.
Avant de plonger dans la liste des plateformes qui proposent ce genre de jobs, voyons ensemble les avantages que présente ce mode de paiement nouvelle génération.
Pourquoi se faire payer en crypto ?
Le secteur de la blockchain a rapidement intégré les cryptomonnaies aux modèles de travail traditionnels. Résultat : des milliers de postes à pourvoir dans tous les domaines, rémunérés directement en cryptos.
Parmi les bénéfices notables :
- Des paiements rapides et peu coûteux : les frais de transaction sont minimes, et les virements se font en quelques minutes.
- Une ouverture internationale : plus besoin d’être dans le même pays (ou fuseau horaire) que votre employeur.
- Un accès facilité aux micro-tâches : grâce à des frais faibles, même les petits contrats deviennent intéressants.
En résumé, tout le monde peut désormais accéder à un job crypto-friendly, que vous soyez développeur, designer ou assistant virtuel.
Où trouver des jobs rémunérés en crypto ?
LaborX
LaborX est une plateforme de type job board qui met en relation freelances et employeurs. On y trouve aussi bien des missions ponctuelles que des postes à temps plein. Les paiements peuvent se faire en plusieurs cryptomonnaies, selon vos préférences.
La plateforme est gérée par une entreprise blockchain spécialisée dans les solutions RH – un bon point pour la fiabilité.
Jobs4Bitcoins (sur Reddit)
Malgré son nom, cette section de Reddit propose toutes sortes de jobs rémunérés en cryptomonnaie, pas uniquement en Bitcoin.
Les utilisateurs postent soit des offres d’emploi, soit leurs compétences. Le système est libre et ouvert, mais non vérifié, donc prudence est de mise.
Blocklancer
Blocklancer est une autre plateforme dédiée aux freelances crypto. Ici, vous êtes payé en Ethereum pour des missions très variées : rédaction, analyse, développement, etc. En cas de conflit, un système de médiation est proposé. Et si vous préférez être payé dans une autre crypto ou en euros, vous pouvez facilement échanger vos ETH avec l’appli Tap.
Bitfortip
Vous aimez donner des idées ? Bitfortip permet de gagner des tips en crypto (Bitcoin, Bitcoin Cash, Tezos, NANO) simplement en répondant à des questions postées par les autres utilisateurs.
C’est un format plus informel, mais idéal pour se lancer en douceur dans l’univers des cryptos.
PompCryptoJobs
PompCryptoJobs est une plateforme dédiée aux métiers du Web3. Vous y trouverez des postes à temps plein, dans des entreprises sérieuses du secteur : UX designer, data analyst, développeur, rédacteur… le tout rémunéré en crypto.
Le site est bien structuré, professionnel, et régulièrement mis à jour.
Comment recevoir un salaire en crypto ?
Si vous ne savez pas comment être payé en cryptomonnaie, Tap vous facilite la vie.
Notre application propose un compte dédié aux indépendants et freelances, permettant de recevoir des paiements en cryptos et en devises classiques.
En ouvrant un compte, vous avez accès à :
- Des portefeuilles crypto sécurisés
- Des IBANs pour les virements en euros, dollars ou livres sterling
- Les adresses de portefeuille à partager avec votre employeur
Il suffit d’envoyer votre adresse crypto au client, et le paiement est reçu en quelques minutes.
Et pour vos dépenses du quotidien ? Avec la carte Tap, vous pouvez utiliser vos cryptos comme de l’argent classique – que ce soit pour régler un café, faire vos courses ou payer vos abonnements.
En conclusion
Le monde du travail évolue, et avec lui, les moyens de se faire payer. Grâce à la cryptomonnaie, vous pouvez travailler sans frontières, avec plus de flexibilité et de rapidité. Que vous soyez développeur, créatif ou tout simplement curieux, il y a probablement une mission crypto qui vous attend.
Alors, prêt à décrocher votre premier job payé en crypto ?


Did you know some chart patterns boast success rates of over 80% when spotted and used correctly? While the market often feels chaotic, decades of historical data reveal that price movements tend to repeat in recognisable ways.
For many investors and traders, these patterns are seen as the market’s “body language,” offering clues about shifts in momentum and sentiment. Every move on a stock chart reflects what investors are thinking and doing, and once you learn to “read” those signals, the idea is that you can spot whether a stock is likely to keep running or flip directions.
The real power isn’t in predicting the future (nobody can do that). It’s about stacking the odds in your favour. Patterns help you zero in on higher-probability setups, fine-tune your entries and exits, and manage risk more effectively, meaning smarter trades and fewer costly mistakes.
In this guide, we’ll break down several reliable patterns and show you which timeframes matter.
The best timeframes for chart pattern analysis
Before diving into specific patterns, you need to understand that timeframe selection dramatically impacts pattern reliability. The same asset can show completely different patterns depending on whether you're looking at 15-minute, daily, or weekly charts.
For instance, take Bitcoin below: the very same moment in time can look completely different on a daily chart versus a monthly chart.

Source: TradingView | 1 day vs 1 month trading charts
Daily charts
For most investors, daily charts often hit the sweet spot because they balance short-term noise with more reliable signals. Patterns that take weeks or months to form on daily charts tend to be more trustworthy because they reflect genuine shifts in market sentiment rather than momentary blips.
4-hour charts
If you’re swing trading (holding positions for days or weeks) 4-hour charts are likely going to be your best friend. They capture medium-term trends and provide more opportunities than daily charts, while still being reliable enough for professional traders to use when sharpening their entries and exits.
15-minute charts
Then there are 15-minute charts, the playground of active traders. They can be exciting, but here’s the catch: shorter timeframes often mean more false signals. You might spot plenty of patterns, but their accuracy drops fast. Only use these if you can stay glued to the screen and stick to strict risk controls.
Many traders chose to blend their timeframes in a layered strategy. Starting with daily charts to lock onto the bigger trend, then zooming into shorter ones to pinpoint their entry.
The 5 most well-known chart patterns for timing
1. Head and Shoulders
The Head and Shoulders formation is one of the most widely studied and discussed reversal patterns in technical analysis. It’s often described as the market’s way of “topping out,” suggesting that an uptrend may be running out of steam.
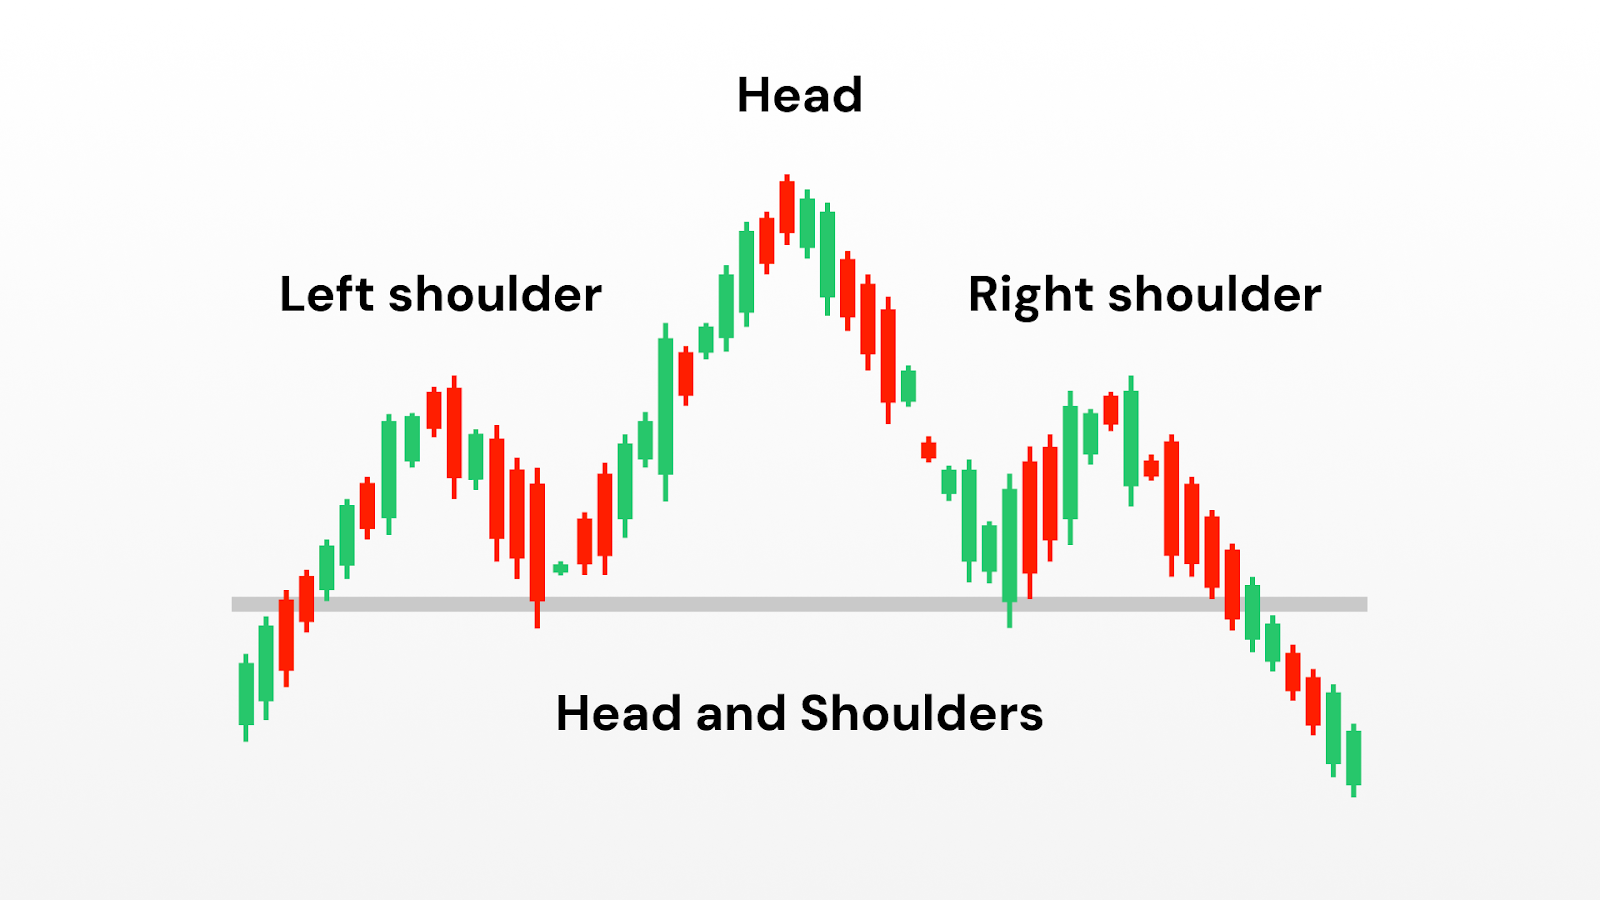
Structure of the pattern
- The left shoulder: An initial rally creates a peak, followed by a decline.
- The head: A stronger rally pushes prices to a higher peak than before, but the move is not sustained.
- The right shoulder: A final attempt to rise falls short of the head’s height, showing reduced momentum.
- The neckline: A line connecting the two low points between the shoulders and the head, often used as a reference for when the pattern is considered “complete.”
When this sequence appears, many analysts view it as a sign that bullish pressure is fading and that selling interest is beginning to dominate.
Why it matters
The head and shoulders pattern is so closely followed because it reflects a psychological shift:
- The first rally shows enthusiasm.
- The higher peak shows overextension but also reveals strong optimism.
- The final, weaker rally shows that buyers no longer have the same conviction. This shift from strength to weakness is why the pattern is often considered a reliable reversal signal.
Variations
Inverse Head and Shoulders: The opposite version, often seen at market bottoms, where the formation suggests a shift from selling pressure to renewed buying interest.
Complex Head and Shoulders: In some markets, extra shoulders may form, reflecting prolonged tug-of-war before momentum reverses.
Caveats
Despite its reputation, the head and shoulders is not foolproof. False signals are common, particularly in thinly traded assets or during periods of high volatility.
Many traders treat it as a useful warning sign rather than a guarantee, and they often combine it with other forms of analysis (such as trend strength, support and resistance zones, or macro factors) to build confidence in their interpretation.
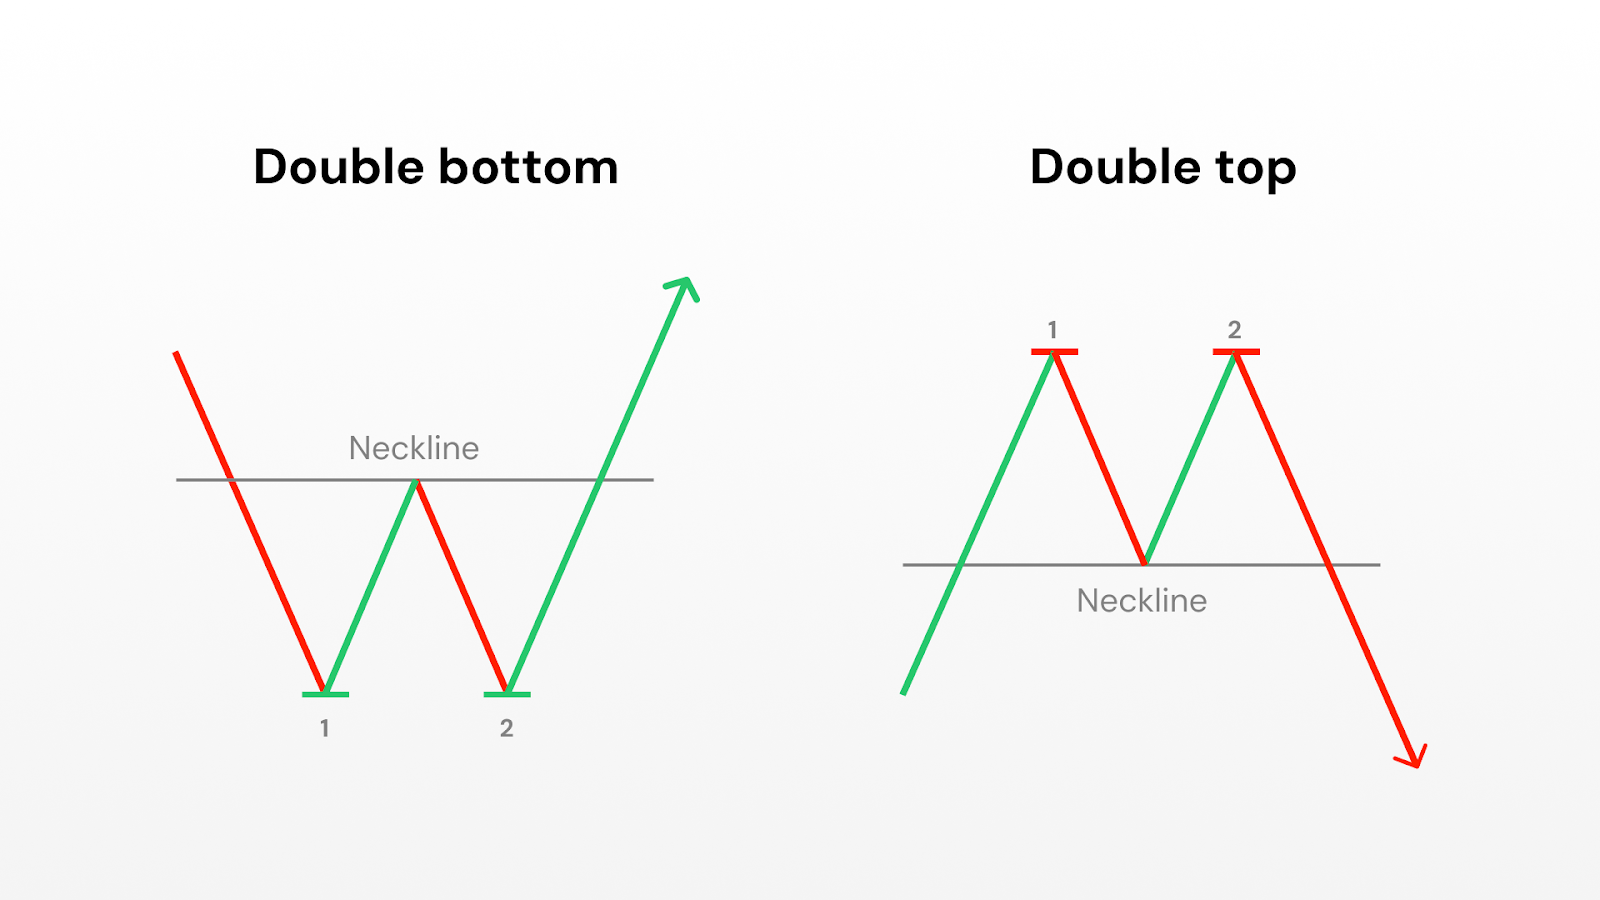
2. Double Bottom/Top
Double Bottoms (bullish) and Double Tops (bearish) are among the simplest and most recognisable reversal patterns in technical analysis.
They occur when the price tests the same level twice and fails to break through, creating what looks like a “W” (double bottom) or an “M” (double top) on the chart.
Analysts often interpret these formations as signals that a prevailing trend may be losing strength.
Structure of the pattern
- Double Bottom:
- The first trough forms after a decline, followed by a rebound.
- A second trough appears at or near the same price level as the first, showing that sellers were unable to push prices much lower.
- The interim peak between the two troughs creates a resistance line that observers often watch as a reference point.
- Double Top:
- The first peak forms after an advance, followed by a pullback.
- A second peak occurs at or near the same level as the first but fails to exceed it, showing reduced buying strength.
- The interim valley between the two peaks creates a support line that analysts watch for signs of confirmation.
Why it matters
Double tops and bottoms are considered significant because they capture a classic battle between buyers and sellers. The first test establishes an important price level, while the second test highlights the inability of the market to push through that level a second time. This repetition signals a potential turning point:
- In double bottoms, the failure to break support is often interpreted as a sign of strengthening demand.
- In double tops, the failure to break resistance is seen as evidence of weakening demand.
Variations
Broad or Narrow Spacing: The distance between the two peaks or troughs can vary. Wider spacing often indicates a more meaningful shift in sentiment.
Multiple Tests: Sometimes prices test the same support or resistance level more than twice before a trend change occurs, creating what some analysts call “triple tops” or “triple bottoms.”
Caveats
Like all technical formations, double tops and bottoms are not guarantees. False signals are common, especially in highly volatile markets where short-term noise can mimic the shape of a pattern without any true shift in momentum.
Analysts often combine this pattern with other tools, such as volume trends, broader market direction, or momentum indicators.
3. Ascending and Descending Triangles
Triangles are continuation patterns that appear when prices start moving in a narrower range. This usually signals a pause in the market before the existing trend continues. The two most common types are Ascending Triangles (often seen as bullish) and Descending Triangles (often seen as bearish).
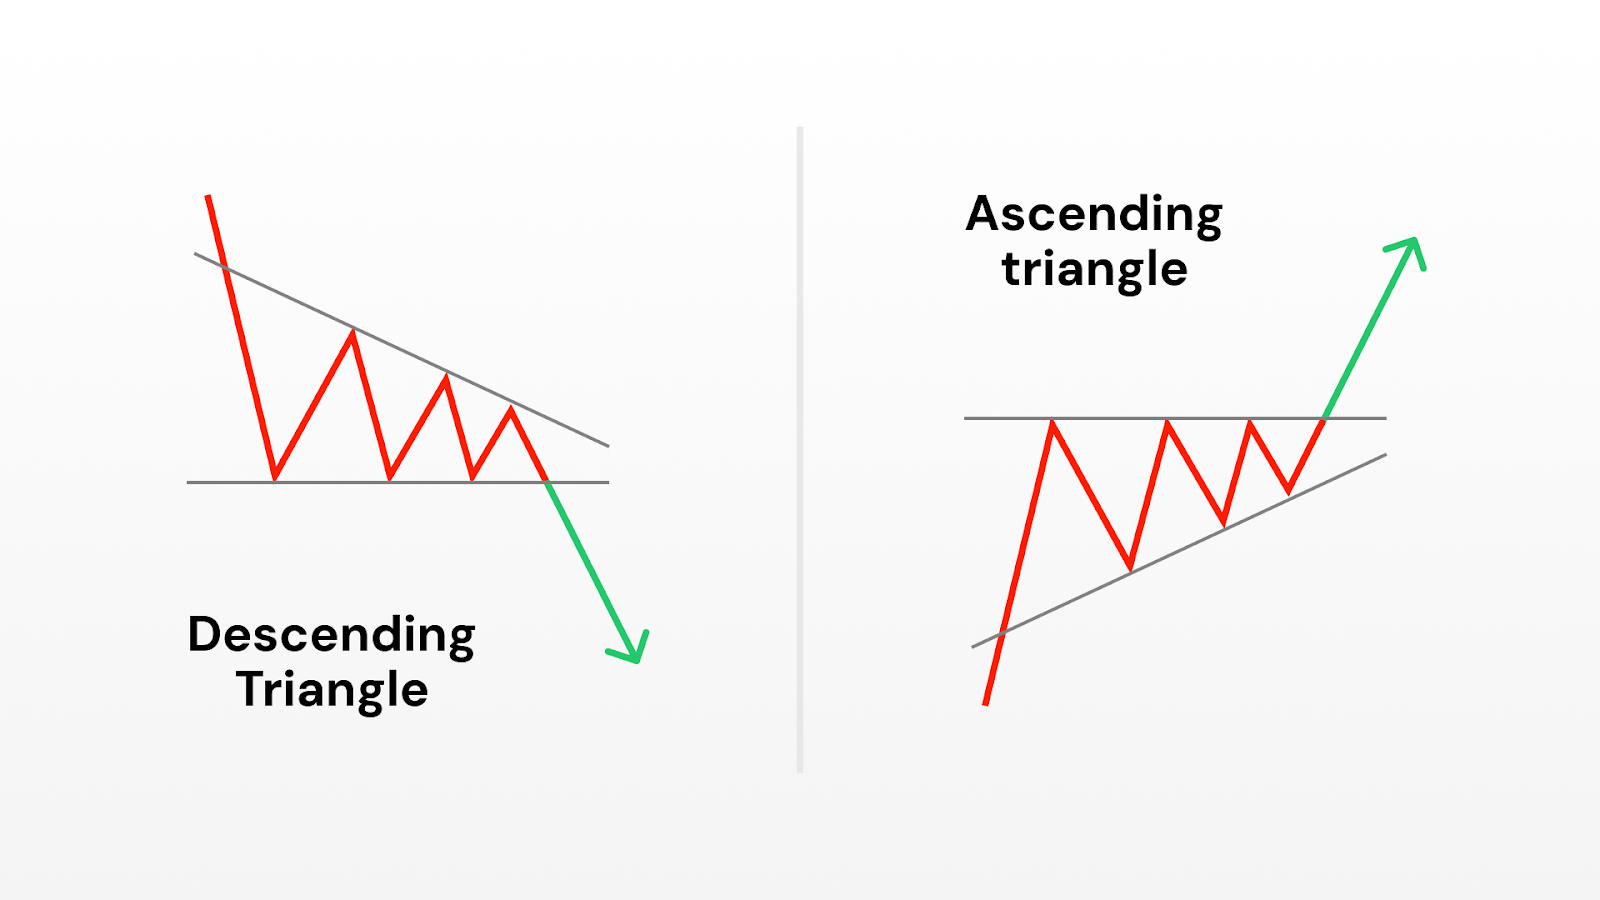
Structure of the pattern
- Ascending Triangle: Price makes a series of higher lows while repeatedly testing the same horizontal resistance. This shows that buyers are becoming more aggressive, steadily bidding prices higher, while sellers defend a key level.
- Descending Triangle: Price makes a series of lower highs while testing a horizontal support. This suggests that sellers are increasingly dominant, though buyers continue to defend a price floor.
- The breakout level: The horizontal line of support (in descending) or resistance (in ascending) is the critical feature analysts watch, as it represents the point where supply or demand may finally give way.
Why it matters
Triangles reflect consolidation: a period where the market pauses, often as traders wait for new information or a decisive shift in sentiment.
- In ascending triangles, the sequence of higher lows highlights persistent demand, hinting at underlying bullish pressure.
- In descending triangles, lower highs point to mounting selling pressure, often seen as bearish.
Variations
Symmetrical Triangles: Unlike ascending or descending, both highs and lows converge toward a point. These are sometimes called “bilateral” patterns, as they can break in either direction.
Time to completion: Many studies suggest that triangle patterns typically resolve before prices reach the tip of the triangle; if not, the pattern may lose significance.
Caveats
While widely followed, triangles are not predictive in isolation. Breakouts can and do fail, particularly in choppy or news-driven markets. Analysts often seek confirmation through trading volume or other trend indicators before treating the pattern as meaningful.
4. Cup and Handle
The Cup and Handle is a long-term bullish pattern named for its resemblance to a teacup. It is frequently studied in equity markets and is often associated with extended uptrends when it completes successfully.
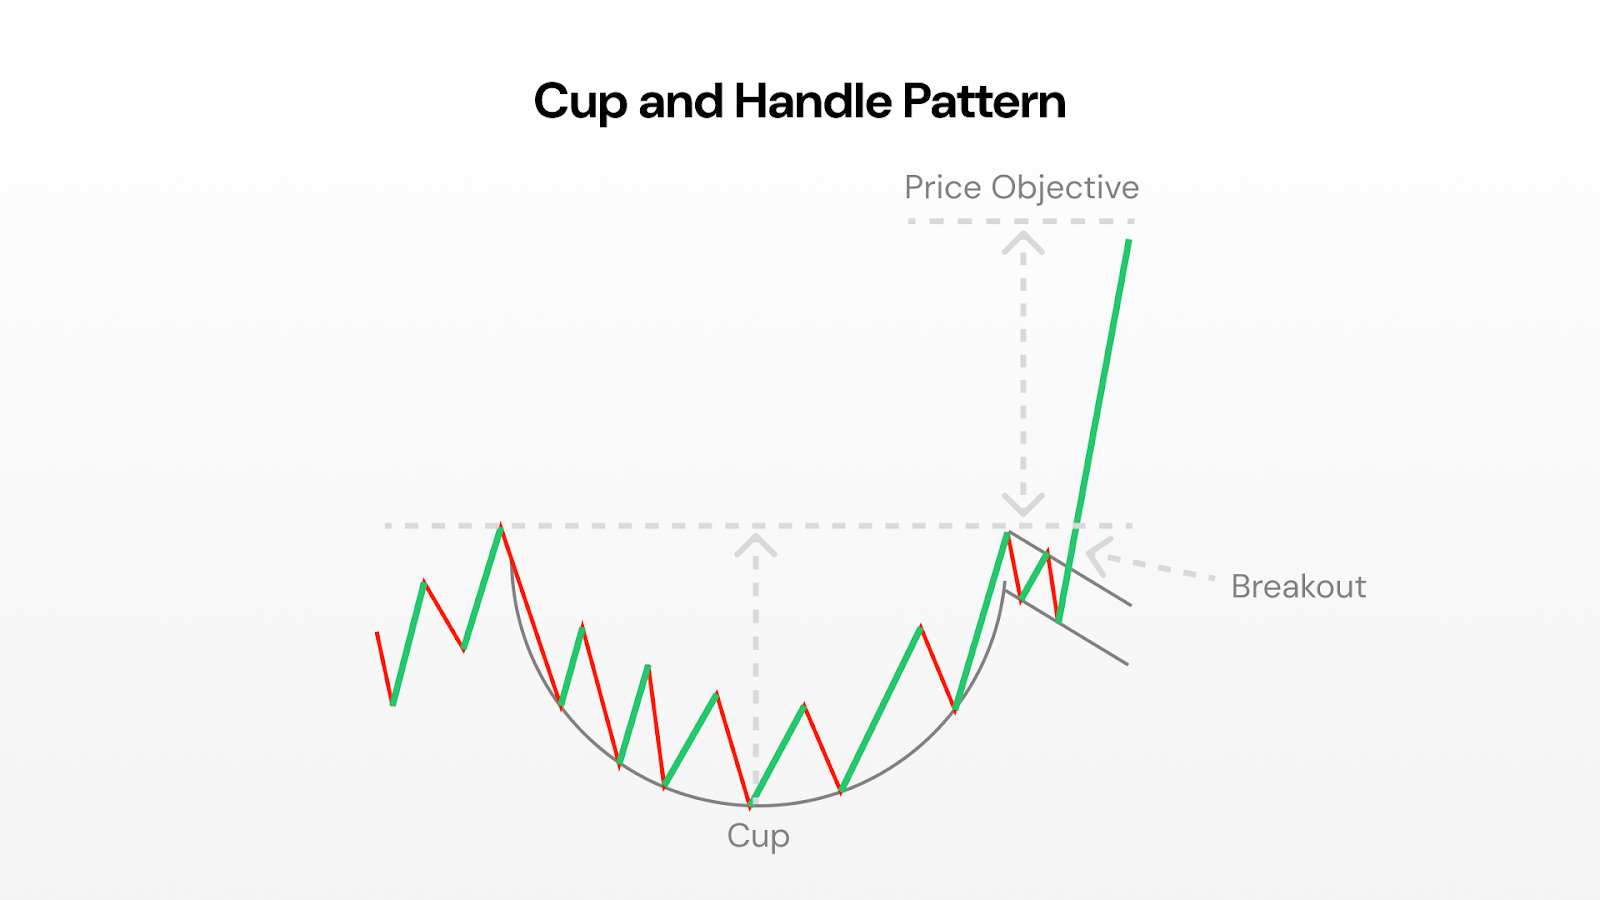
Structure of the pattern
- The Cup: Prices decline gradually, bottom out, and then recover in a rounded, U-shaped curve. The depth of the cup reflects the extent of the pullback before sentiment recovers.
- The Handle: After the cup completes, prices typically consolidate sideways or drift slightly downward in a shorter, shallower formation. This pause is seen as a “shakeout” of weaker hands before a new advance.
- The Breakout Level: The top of the cup, where prices previously peaked before declining, becomes a reference level for confirmation.
Why it matters
The Cup and Handle is often interpreted as evidence of a market shaking off selling pressure and regaining strength. The extended base (the cup) suggests long-term accumulation, while the smaller handle shows short-term hesitation before renewed buying. This blend of consolidation and recovery is why the pattern is often associated with continuation of an uptrend.
Variations
Deep vs. shallow cups: Shallow cups are generally considered stronger, as they indicate lighter selling pressure. Very deep cups can signal weaker underlying demand.
No handle: Occasionally, prices break out directly after forming the cup without creating a handle. Some analysts treat these as valid, while others consider the handle an essential feature.
Caveats
Because cup and handle formations often take weeks or months to develop, they can be subjective. False signals are common if the “handle” drifts too low or if volume patterns don’t align with expectations. As with other patterns, context (i.e. broader market trends and sector strength) is critical.
5. Flag Patterns
Flag patterns are short-term continuation formations that occur after sharp price movements, known as “flagpoles.” They are named for their resemblance to a flag on a pole: a rapid advance or decline, followed by a small rectangular consolidation sloping against the trend.
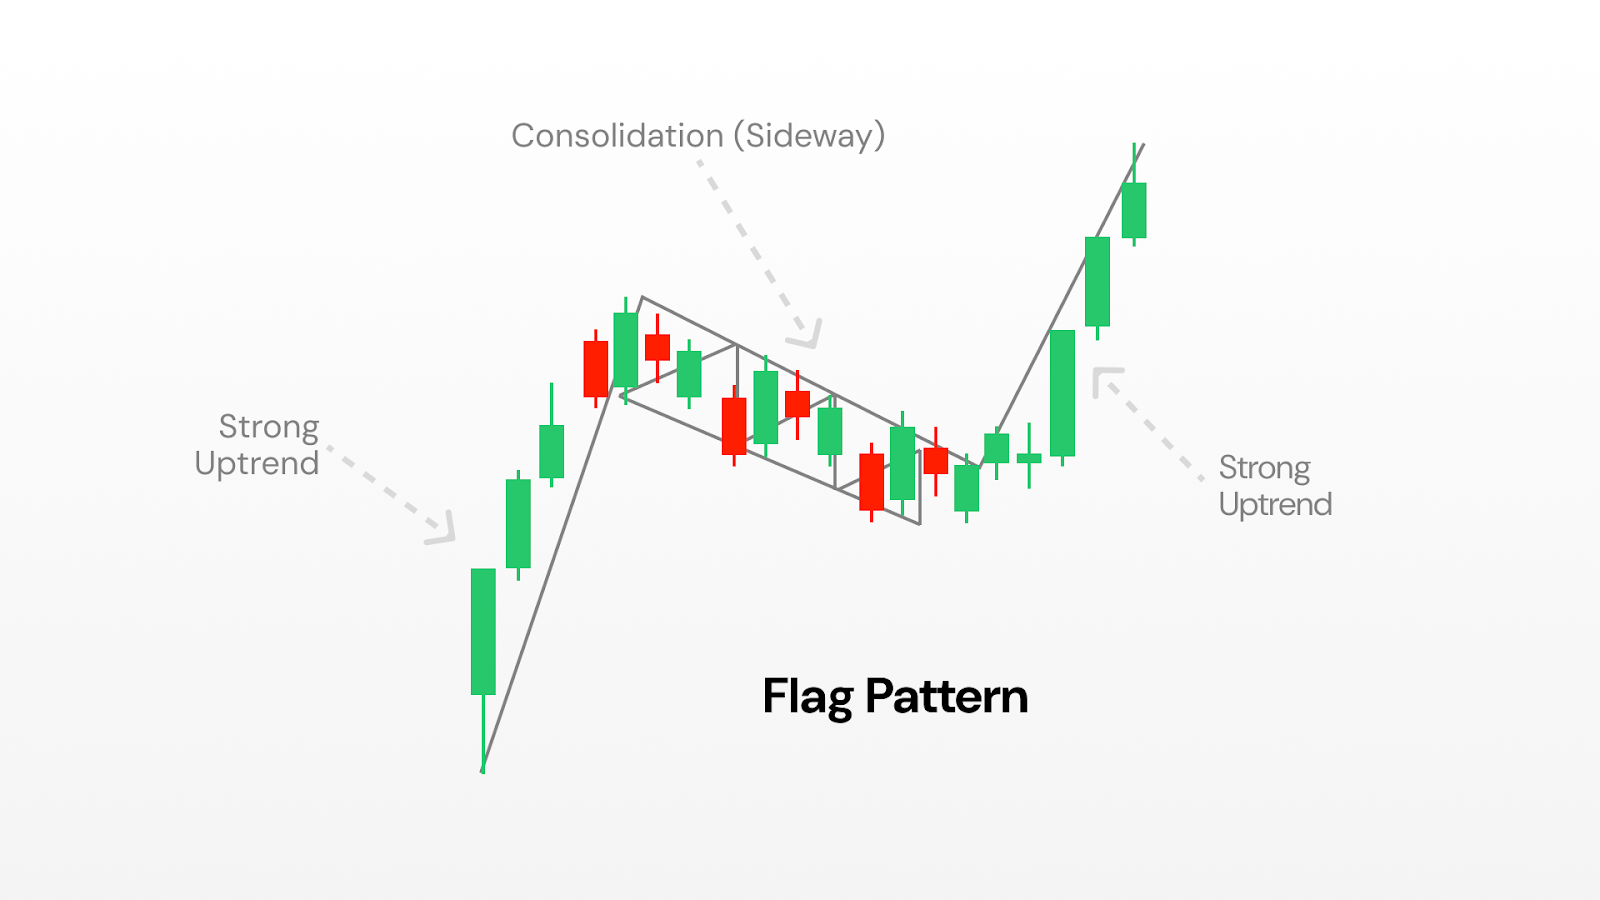
Structure of the pattern
- The Flagpole: A sudden, strong move in one direction, often accompanied by high trading volume.
- The Flag: A brief consolidation where prices move sideways or slightly against the prevailing trend, usually within parallel lines that slope modestly.
- Resolution: If the pattern holds, the prevailing trend resumes after the consolidation.
Why it matters
Flags capture the rhythm of momentum markets. The flagpole reflects urgency, often from institutional buying or selling, while the flag represents a pause where the market digests the move. This pause is considered healthy in a trend, as it can prevent overextension.
Variations
Bullish vs. Bearish Flags: Bullish flags slope downward after an upward flagpole, while bearish flags slope upward after a downward pole.
Pennants: A related pattern where consolidation takes the form of a small symmetrical triangle rather than a rectangle.
Caveats
Flags are short-term patterns, often lasting only a few sessions to a few weeks. Because they form quickly, they are prone to producing false signals, especially in volatile markets. Analysts stress the importance of volume dynamics and overall market context before giving weight to a flag formation.
Pattern categories: continuations vs reversals
Not all patterns tell the same story. Some hint that the market is just taking a breather before carrying on, while others warn that momentum is running out and a reversal could be around the corner.
Continuation patterns - think triangles, flags, and pennants - pop up roughly 70% of the time when a market is trending. They usually mean the pause is temporary and the trend is about to resume.
Reversal patterns - like head and shoulders or double tops and bottoms - are less common but pack more punch. When they appear, they often mark a major turning point.
Then there are bilateral patterns such as symmetrical triangles. These are trickier because they can break either way. They tend to shine in volatile, uncertain markets where direction isn’t obvious.
The secret is context. Continuation patterns work best when the trend is already strong, while reversal patterns are most powerful after a long, extended move. Match the pattern to the bigger picture, and you’ll read the market with far more accuracy.
How traders often approach chart patterns
Spotting a pattern is just the start. To trade them successfully, you need a clear set of rules for when to act, how much to risk, and when to walk away. These rules will be specific to your personal needs, and should be discussed with a financial advisor if you’re unsure.
Confirm your entry. Analysts generally stress the importance of waiting for confirmation (like a breakout or changes in volume) before treating a pattern as complete. Set alerts at key levels so you don’t waste hours glued to charts.
Protect yourself with stop-losses. Most traders place their stop just beyond the pattern’s critical level. For breakouts, that means just below the breakout point; for reversals, just beyond the highest high or lowest low.
Set realistic profit targets. The measured move gives you a solid first target. Many traders take partial profits there (say half the position) and let the rest ride with a trailing stop, locking in gains while leaving room for more upside.
Size your positions wisely. Risk management is often discussed in terms of position sizing. For example, some traders limit risk on a single trade to just a small percentage (e.g. 2-3%) of their account, so that several losses don’t cause major damage.
Respect the clock. Patterns don’t work forever. If the move hasn’t unfolded within the expected window (usually 2-3 weeks on daily charts), it’s often best to exit, even if your stop hasn’t been triggered.
Do chart patterns really work?
Chart patterns aren’t crystal balls, but they can give you a genuine statistical edge when used properly. Studies show that well-formed patterns on highly liquid stocks deliver success rates between 60-85%, far better than pure chance.
That said, no pattern is bulletproof. Around a quarter to nearly half of them will fail. This is why risk management and position sizing aren’t optional; they’re your safety net. You need to be able to take several hits without blowing up your account.
Patterns also don’t exist in a vacuum. They’re much more reliable when they line up with the bigger picture - things like the overall market trend, sector strength, or even key fundamentals. A bullish setup in a weak sector or during a bear market has the odds stacked against it.
And remember: context is everything. Chart patterns work best in “normal” market conditions. In periods of extreme volatility, major news events, or panic-driven trading, emotions often override technical signals.
Level up: advanced pattern techniques
Once you’re comfortable spotting the basics, a few advanced techniques can take your timing to the next level.
Watch the volume. Real breakouts usually come with a surge, at least 50% above recent average volume. Volume should also “fit the story”: tapering off during consolidation, then expanding sharply when the breakout hits.
Use multi-timeframe confluence. When the same pattern shows up on both daily and weekly charts, or when shorter-term setups align with longer-term trends, your odds of success might climb.
Validate with support and resistance. The strongest patterns often form at levels the market has respected before. Multiple past tests of support or resistance add weight to the signal and help filter out false moves.
And always remember: chart patterns aren’t fortune tellers. They’re tools to tilt the odds in your favour, not guarantees of profit. Combine them with sound risk management, diversification, and realistic expectations. With practice and discipline, pattern recognition can become a powerful part of your trading toolkit.


