


Bitcoin Crashes Below $82K in Brutal Sell-Off
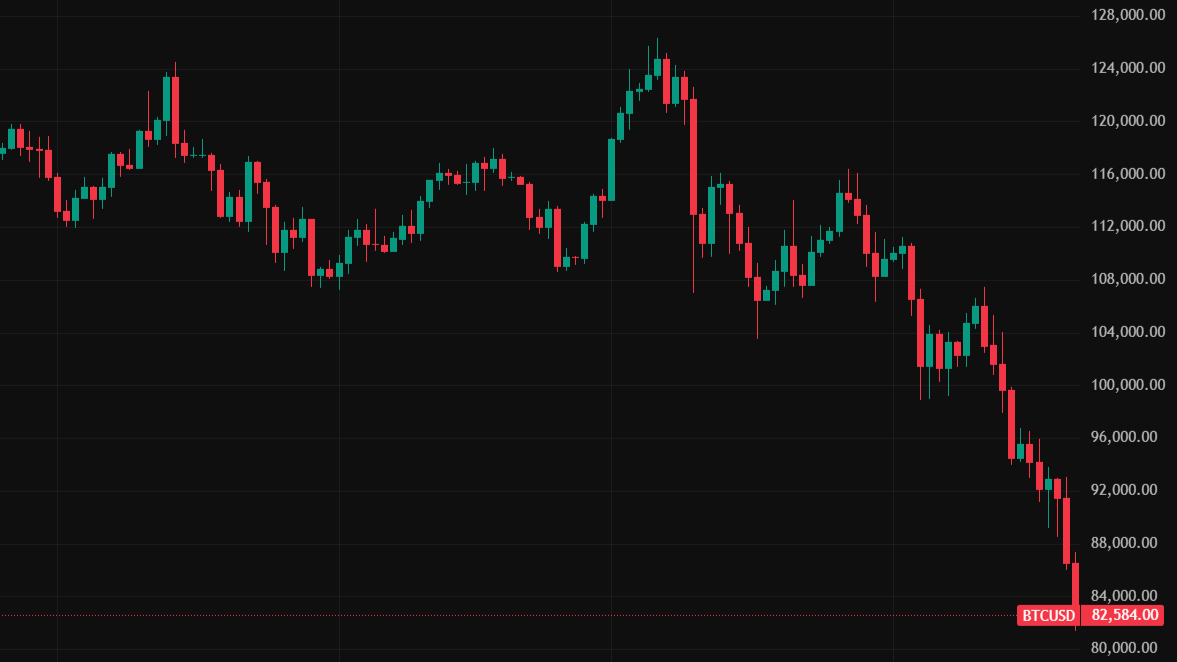
After breaking through several support levels, Bitcoin is trading around $82,000, extending a punishing downtrend that has erased more than 30% of its value since October's peak at $126,000.
The cause? A perfect storm of selloffs in U.S. equity markets, which triggered a wave of risk aversion that swept through global markets. Meanwhile, the Federal Reserve's cautious stance on further rate cuts has injected fresh uncertainty into trading floors. Markets still anticipate a 0.25% cut, but with recession fears intensifying, traders are hitting the exits. Crypto found itself directly in the crosshairs of this flight to safety
The damage extended well beyond Bitcoin. Estimates show around $2 billion in crypto positions liquidated, as forced selling and evaporating liquidity accelerated the downturn across digital assets. But here's a twist for you: Bitcoin is now entering territory that has historically preceded major recoveries. Let’s dive in.
Bitcoin Is Officially Oversold… And That Matters
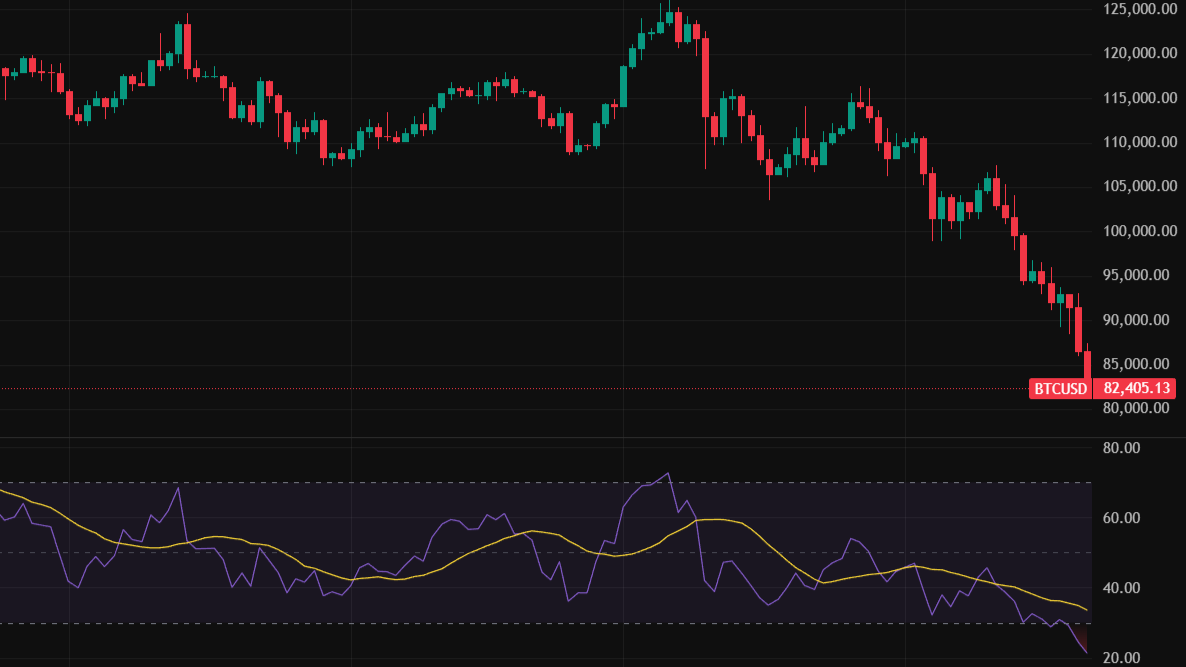
The Relative Strength Index (RSI) has officially moved into oversold territory for the first time in nine months, signaling extreme selling pressure. The last time BTC hit oversold levels was in February, right before a notable rebound. Oversold signals don’t guarantee an immediate reversal, but they often mark the beginning of seller exhaustion.
In the previous oversold event, BTC dropped around an additional 10% before bouncing. If that were to happen again, BTC could briefly dip toward $77,000 before bulls regain momentum. If the current selling eases earlier, a shorter-term bounce could happen sooner.
MVRV Points to Undervaluation
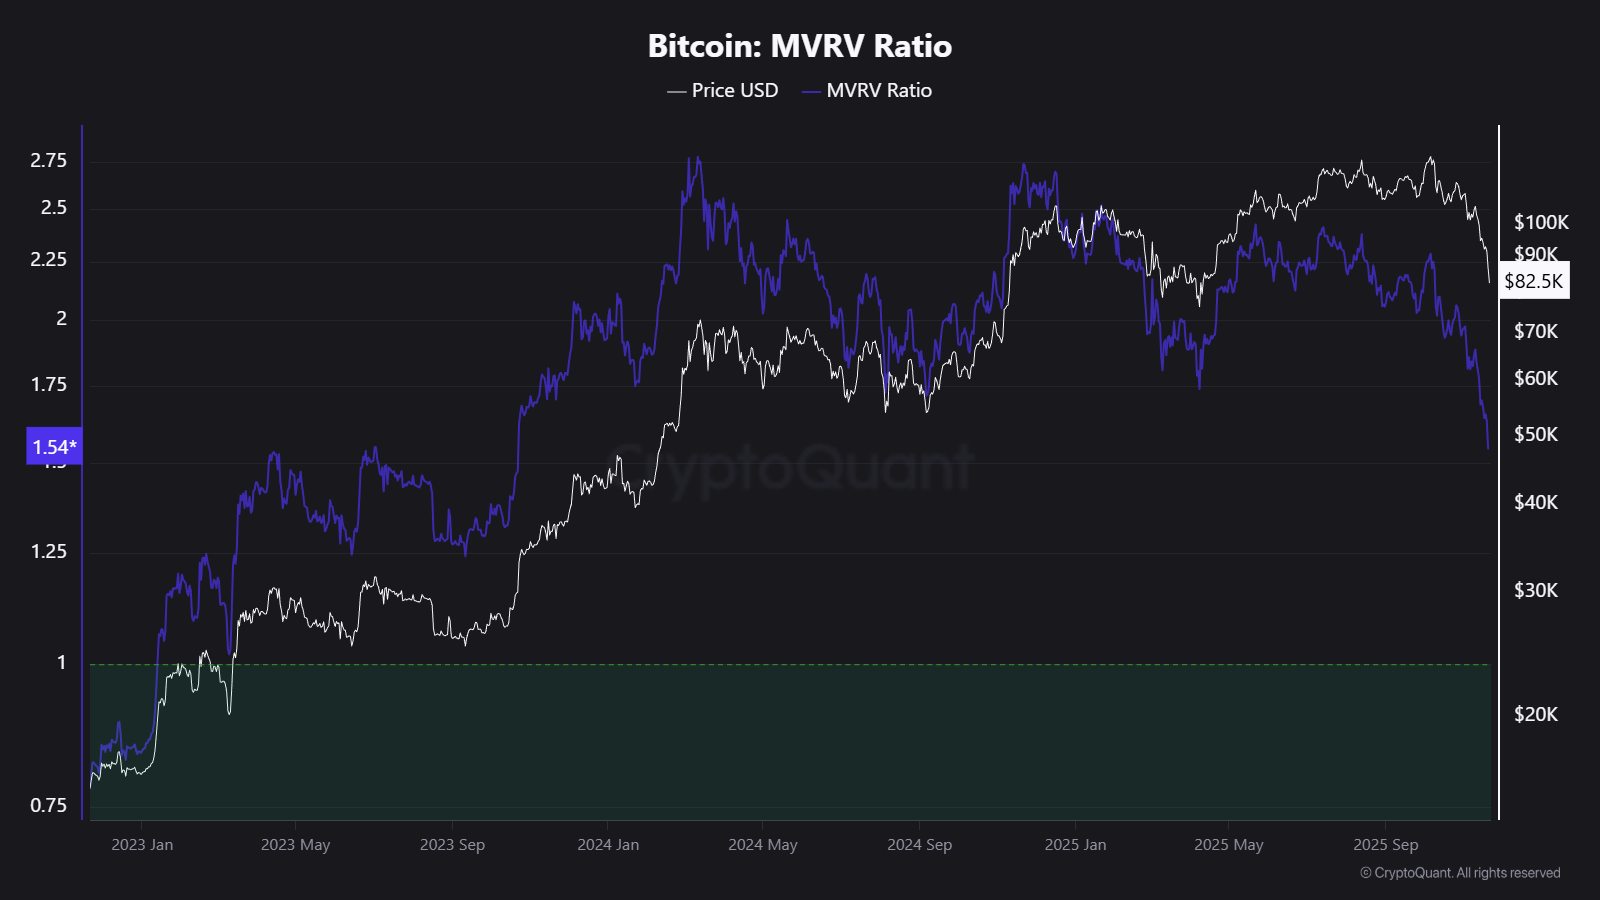
Another key indicator worth looking at is Bitcoin’s MVRV Ratio. This on-chain indicator reveals whether investors are collectively sitting on profits or losses. An MVRV Ratio above 1 means the average holder is in the green; below 1 signals most are underwater.
BTC’s MVRV now sits at 1.5, its lowest level in over two years. When MVRV enters a “opportunity zone”, it suggests two things:
- Many short-term holders are underwater
- Downside selling pressure is approaching exhaustion
Key Levels to Watch
If bearish pressure continues, it’s possible BTC could revisit the $80,000 level, with a deeper support level around $77,000, matching the RSI’s recent historical pattern.
But there’s also a realistic bullish scenario: reclaiming $92,000 could turn the structure decisively bullish, opening the door to the $95,000 region and beyond.
What Can We Expect From BTC This November?
Beyond the indicators, there’s a seasonal angle worth emphasizing: Bitcoin has historically shown strong end-of-year recoveries and rallies. Even during weaker macro environments, Q4 has often delivered rebounds driven by renewed risk appetite and improved liquidity flows.
Combine that with oversold technicals, undervaluation signals, and easing macro uncertainty if the Fed does follow through on cuts, and the current levels could start looking less like panic territory and more like potential opportunity.
The Takeaway
Bitcoin's slide doesn’t appear to be driven by broken fundamentals; it's the result of macro turbulence, risk-off positioning, and temporary sentiment shifts. Short-term chop may persist, but on the flip side, key indicators are flashing oversold conditions which have historically marked turning points.
Corrections are part of Bitcoin's DNA. It has survived far steeper crashes and consistently emerged more resilient. Whether the bounce starts today or after one final shake-out, the pattern is familiar: selling exhaustion plants the seeds for the next rally. Patient holders have seen this pattern many times, and more often than not, their patience has been rewarded.
This article is for general information purposes only and is not intended to constitute legal, financial or other professional advice or a recommendation of any kind whatsoever and should not be relied upon or treated as a substitute for specific advice relevant to particular circumstances. We make no warranties, representations or undertakings about any of the content of this article (including, without limitation, as to the quality, accuracy, completeness or fitness for any particular purpose of such content), or any content of any other material referred to or accessed by hyperlinks through this article. We make no representations, warranties or guarantees, whether express or implied, that the content on our site is accurate, complete or up-to-date.
